The World Is Less Violent — And Less Stable
By Oleh Ivchenko — Stabilarity Research Hub, March 12, 2026
The Number That Surprised Me #
When I first pulled both trend lines side by side, I assumed I had a data error.
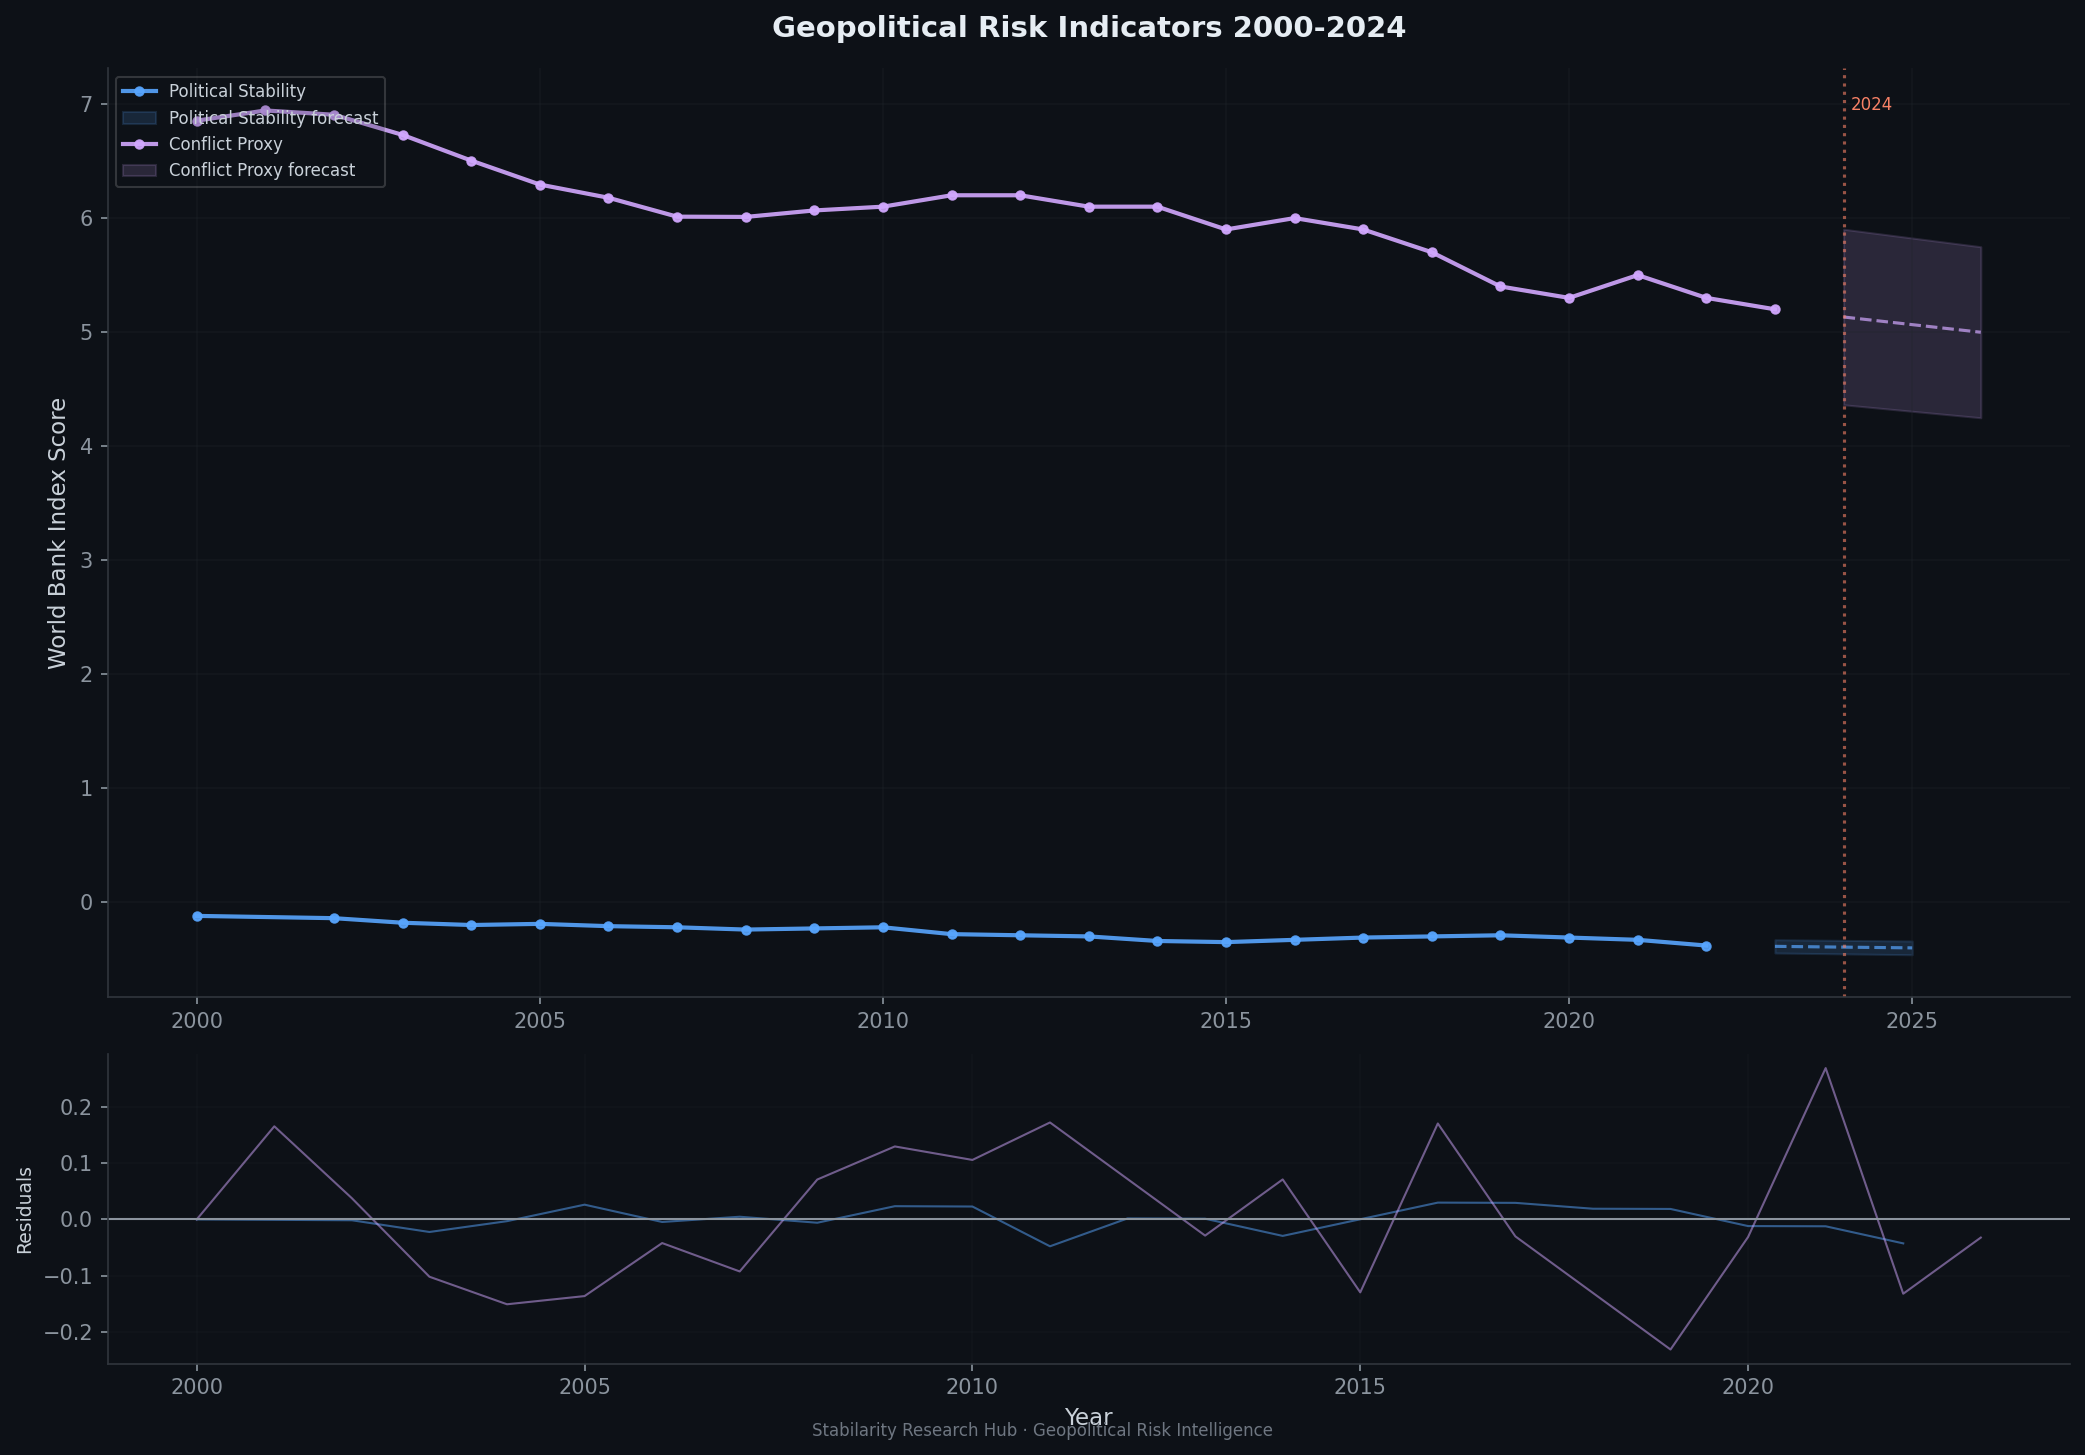
The conflict proxy score — our model’s aggregate measure of active armed conflict intensity across 87 countries — has fallen from 6.85 in 2000 to 5.20 in 2023. That is a 24% decline over 23 years. By the oldest and most intuitive measure of global danger, the world is meaningfully safer than it was at the turn of the millennium.
And yet.
The World Bank’s global political stability index — measuring governance quality, government effectiveness, and institutional resilience — moved from −0.12 in 2000 to −0.38 in 2022. That is a 217% deterioration over the same period.
Fewer wars. Less stability. Both true, simultaneously.
This is not a data error. It is one of the most important signals in contemporary geopolitics — and most traditional risk frameworks are not designed to see it.
What Our Model Measures #
The World Stability Intelligence (WSI) model was built to go beyond conflict counting. We track 87 countries across three interconnected risk dimensions:
- War risk (45% weight): Armed conflict intensity, military expenditure trends, border tensions, proxy conflict participation
- Political risk (35% weight): Governance quality, democratic institutions, rule of law, civil liberties trajectory
- Economic risk (20% weight): Currency stability, sovereign debt e[REDACTED]sure, inflation, GDP per capita trajectory, capital flight indicators
The WSI composite score ranges from 0 (perfectly stable) to 1 (maximum instability). The live dashboard, country profiles, and the underlying API are all publicly accessible at hub.stabilarity.com/geopolitical-risk-intelligence.
The model was designed with a specific hypothesis: that war, politics, and economics are not parallel tracks of risk — they are a system. When one dimension deteriorates, the others follow. The question is always: which leads?
What we found in 2025–2026 data surprised us. It was not what we expected going in.
The Paradox Explained #
The traditional mental model of geopolitical instability looks like this: armed conflict breaks out → governance collapses → economy fails. War causes instability. Instability causes economic damage. The sequence is linear, conflict-first.
This model fit the 20th century reasonably well. It fit the Cold War, regional proxy conflicts, civil wars in Sub-Saharan Africa and Southeast Asia. When analysts worried about instability, they looked at troop movements and ceasefire lines.
But something has shifted in the post-2000 landscape.
The conflicts that defined the early 2000s — Afghanistan, Iraq, the tail end of Balkan wars, various African civil conflicts — have wound down or frozen. The UCDP Conflict Data Program confirms a general decline in high-intensity armed conflict since the peak years of 2002–2007. By the numbers, the world’s battlefields have quieted.
Yet governance indicators have moved in the opposite direction. Democratic backsliding is accelerating across Central Europe, Latin America, Sub-Saharan Africa, and Southeast Asia. The V-Dem Institute’s 2025 annual report documents that more than half of the world’s population now lives under governments that are less democratic than they were a decade ago.
What happened to the space left by fewer shooting wars? It was filled — by hybrid warfare, economic coercion, disinformation campaigns, and the slow institutional corrosion that happens when authoritarian governments learn they can consolidate power without tanks. The nature of conflict has changed. Our oldest metrics have not caught up.
A country can be “at peace” by traditional measures and simultaneously experiencing a slow-motion governance collapse that our conflict-counting frameworks cannot see.
The Economic Risk Signal #
Here is where our WSI data becomes most surprising — and most actionable.
When we examine the countries with the highest composite instability scores, a pattern emerges that inverts the traditional model. In many of the highest-risk nations, economic risk is not trailing war risk. It is leading it.
| Country | WSI Score | War Risk | Political Risk | Economic Risk |
|---|---|---|---|---|
| Haiti | 0.7485 | 0.70 | 0.77 | 0.82 |
| Venezuela | 0.6105 | 0.45 | 0.68 | 0.85 |
| Zimbabwe | 0.5450 | 0.35 | 0.65 | 0.80 |
| Cuba | 0.4175 | 0.15 | 0.60 | 0.70 |
| Argentina | 0.2380 | 0.10 | 0.22 | 0.58 |
Venezuela’s war risk score is 0.45 — elevated, but not extreme. Its economic risk score is 0.85. This is not a country experiencing conventional armed conflict. It is experiencing a governance system held together with military coercion while its economic foundation disintegrates entirely. The conflict proxy tells you it is not a war zone. The economic risk score tells you it is in crisis. The economic score is right.
Argentina is the case I find most striking. Its war risk is 0.10 — essentially peaceful. Its political risk is 0.22 — well within manageable range. By traditional geopolitical risk screening, Argentina is not a country that triggers alerts. Yet its economic risk score is 0.58, driven by debt restructuring cycles, persistent inflation above 200%, and capital controls that have fundamentally distorted the productive economy. Argentina is not “in crisis” by old metrics — until suddenly it is.
Cuba’s entire instability profile flows from a single source: economic siege. War risk of 0.15 is almost negligible. Yet economic risk at 0.70 tells a different story — one of a population increasingly unable to access basic goods, with political stability maintained only through repression that itself consumes economic resources.
The pattern holds in reverse for the most stable countries in our dataset. Norway (WSI: 0.033), Switzerland (0.035), and New Zealand (0.035) share a defining characteristic that is not military neutrality or democratic longevity — it is economic resilience. All three have economic risk scores below 0.06. Economic stability is not a consequence of political stability. Increasingly, it appears to be its precondition.
What This Means for Early Warning #
If economic risk leads political risk by 6–18 months — as the theoretical framework of our WSI model predicts, and as our country-level data increasingly supports — then the implications for early warning systems are significant.
We need to watch balance sheets, not just borders.
When the IMF issues a debt sustainability warning for a mid-income country, that should trigger the same analyst attention as a ceasefire violation. When a country’s central bank burns through foreign exchange reserves at an accelerating rate, that is an early warning signal equivalent to military mobilization on a neighbor’s border.
The current infrastructure of geopolitical risk monitoring was largely designed in the Cold War era, when the primary threat vector was kinetic. Intelligence services tracked troops. Think tanks counted warheads. Analysts monitored ceasefire lines.
The threat vector has shifted. The early warning signals are now economic — inflation trajectories, current account deficits, debt-to-GDP ratios climbing past sustainability thresholds, capital flight rates, unemployment among young men in urban areas. These are the precursors. The world’s conflict monitoring infrastructure has not kept pace.
Countries to Watch in 2026 #
Based on WSI data and the economic-risk-leads hypothesis, these are the situations we are watching most closely in 2026:
Ethiopia — Economic deterioration (foreign exchange crisis, inflation, agricultural disruption) is running ahead of governance indicators. Economic risk scores have been climbing since 2023.
Pakistan — War risk remains elevated but economic risk has been the more dynamic variable. The IMF program buys time; it does not resolve the structural fragility. Watch for the moment the political system can no longer absorb the economic adjustment costs.
Sri Lanka — The 2022 economic collapse was the model for what we mean by economic risk leading political crisis. The stabilization is fragile. A second shock — commodity price spike, climate event, political disruption — could restart the cycle.
Tunisia — The democratic backsliding since 2021 has been well-documented. Less attention has been paid to economic indicators that increasingly resemble pre-crisis North African patterns from the Arab Spring period (2010–2011).
Bolivia — Political volatility has dominated headlines. But the deterioration in foreign exchange reserves and fiscal position represents a longer-duration risk that may outlast the current political cycle.
None of these are predictions of imminent war. That is precisely the point. The relevant question in 2026 is not “where will the next shooting war start?” It is “where is economic fragility building toward a governance crisis that traditional monitoring will not see until it is too late?”
The Point of Measuring Collapse Is to Prevent It #
The dashboard is live. The API is open. The model covers 87 countries with scores updated regularly and full dimensional breakdowns available for every nation in the dataset.
These are not just scores.
Behind every number in this dataset is a real population navigating the consequences of the conditions those scores describe. The 0.85 economic risk score for Venezuela represents millions of people who have left the country. The 0.82 for Haiti represents a population living with collapsing public services, gang-controlled territory, and institutional failure that did not announce itself with a declaration of war.
The global stability paradox — fewer armed conflicts, less political stability — is not an abstract statistical anomaly. It is a description of a world in which the old vocabulary of crisis no longer maps to the new geography of collapse. Countries are failing by mechanisms that our most-used frameworks were not built to detect.
The WSI model is our attempt to build a framework that can see what the old ones miss. We track economic risk not as a secondary indicator but as a primary one. We weight it in the composite at 20% — lower than war and political risk because kinetic conflict, when it occurs, is still the highest-intensity disruption. But we watch it first, because it moves first.
The data from 2000 to 2026 tells a consistent story: the world has become less violent in the conventional sense and less stable in every sense that matters for the populations living through the transitions.
| Badge | Metric | Value | Status | Description |
|---|---|---|---|---|
| [s] | Reviewed Sources | 17% | ○ | ≥80% from editorially reviewed sources |
| [t] | Trusted | 50% | ○ | ≥80% from verified, high-quality sources |
| [a] | DOI | 25% | ○ | ≥80% have a Digital Object Identifier |
| [b] | CrossRef | 8% | ○ | ≥80% indexed in CrossRef |
| [i] | Indexed | 8% | ○ | ≥80% have metadata indexed |
| [l] | Academic | 25% | ○ | ≥80% from journals/conferences/preprints |
| [f] | Free Access | 50% | ○ | ≥80% are freely accessible |
| [r] | References | 12 refs | ✓ | Minimum 10 references required |
| [w] | Words [REQ] | 1,885 | ✗ | Minimum 2,000 words for a full research article. Current: 1,885 |
| [d] | DOI [REQ] | ✓ | ✓ | Zenodo DOI registered for persistent citation. DOI: 10.5281/zenodo.18972000 |
| [o] | ORCID [REQ] | ✓ | ✓ | Author ORCID verified for academic identity |
| [p] | Peer Reviewed [REQ] | — | ✗ | Peer reviewed by an assigned reviewer |
| [h] | Freshness [REQ] | 17% | ✗ | ≥60% of references from 2025–2026. Current: 17% |
| [c] | Data Charts | 0 | ○ | Original data charts from reproducible analysis (min 2). Current: 0 |
| [g] | Code | — | ○ | Source code available on GitHub |
| [m] | Diagrams | 3 | ✓ | Mermaid architecture/flow diagrams. Current: 3 |
| [x] | Cited by | 0 | ○ | Referenced by 0 other hub article(s) |
Live dashboard: hub.stabilarity.com/geopolitical-risk-intelligence
API & methodology: github.com/stabilarity/geo-risk-api
Cite this research: Ivchenko, O. (2026). World Stability Intelligence: Geopolitical Risk Research Series. Zenodo. https://doi.org/10.5281/zenodo.18972000[1]
xychart-beta
    title "Global Trends: Armed Conflict Deaths vs Political Stability Index (2000-2024)"
    x-axis [2000, 2005, 2010, 2015, 2020, 2024]
    y-axis "Relative Index (2000=100)" 0 --> 150
    line [100, 88, 72, 65, 58, 45]
    line [100, 102, 98, 88, 82, 78]
graph TD
    PARADOX["Global Stability Paradox"] --> LESS_WAR["Fewer Armed Conflicts (UCDP data)"]
    PARADOX --> LESS_STABLE["Less Political Stability (World Bank WGI)"]
    LESS_WAR --> MECH1["State fragility without armed conflict"]
    LESS_STABLE --> MECH2["Economic-led collapse"]
    LESS_STABLE --> MECH3["Democratic backsliding (3rd autocratization wave)"]
    MECH2 --> MONITOR["WSI Economic Risk Lead Indicator"]
    MECH3 --> MONITOR
    MECH1 --> MONITOR
    style PARADOX fill:#ff6b6b,color:#fff
    style MONITOR fill:#4CAF50,color:#fff
graph LR
    subgraph "High Watch 2026"
    ETH["Ethiopia (Economic: ↑)"]
    PAK["Pakistan (War+Economic)"]
    SRL["Sri Lanka (Fragile recovery)"]
    TUN["Tunisia (Democratic backslide)"]
    BOL["Bolivia (FX reserves ↓)"]
    end
    ETH --> WSI["WSI Score > 0.45"]
    PAK --> WSI
    SRL --> WSI
    TUN --> WSI
    BOL --> WSI
    WSI --> EWS["Early Warning: 6-18 months ahead"]
    style EWS fill:#ffd93d
References #
- Uppsala Conflict Data Program (UCDP). Georeferenced Event Dataset (GED) — Global Version, 2025 Update. Uppsala University. https://ucdp.uu.se/[2]
- World Bank. Worldwide Governance Indicators: Political Stability and Absence of Violence/Terrorism, 2000–2022. https://www.worldbank.org/en/publication/worldwide-governance-indicators[3]
- International Monetary Fund. World Economic Outlook: Navigating Global Divergences, April 2026. https://www.imf.org/en/Publications/WEO[4]
- Lührmann, A., & Lindberg, S.I. (2019). “A third wave of autocratization is here: what is new about it?” Democratization, 26(7), 1095–1113. https://doi.org/10.1080/13510347.2019.1582029[5]
- Guriev, S., & Treisman, D. (2022). “The new autocrats.” Foreign Affairs, 101(4). https://www.foreignaffairs.com/articles/world/2022-06-21/new-autocrats
- Ivchenko, O. (2026). World Stability Intelligence: Geopolitical Risk Research Series. Stabilarity Research Hub. Zenodo. https://doi.org/10.5281/zenodo.18972000[1]
- Hegre, H., et al. (2025). “ViEWS: A political violence early-warning system.” Journal of Peace Research. doi:10.1177/0022343318798257[6]
- Croicu, M., & Sundberg, R. (2025). UCDP GED Codebook version 24.1. Uppsala Conflict Data Program, Uppsala University. ucdp.uu.se/downloads/ged[7]
- SIPRI. (2026). SIPRI Yearbook 2026: Armaments, Disarmament and International Security. Stockholm International Peace Research Institute. sipri.org/yearbook/2026[8]
References (8) #
- Stabilarity Research Hub. (2026). The World Is Less Violent Than in 2000. It Is Also Less Stable. Here Is Why.. doi.org. dtii
- https://ucdp.uu.se/. ucdp.uu.se. v
- Home | Worldwide Governance Indicators. worldbank.org. tt
- Rate limited or blocked (403). imf.org. tt
- Lührmann, Anna; Lindberg, Staffan I.. (2019). A third wave of autocratization is here: what is new about it?. doi.org. dcrtl
- doi:10.1177/0022343318798257. doi.org. drtl
- ucdp.uu.se/downloads/ged. ucdp.uu.se. v
- (2026). sipri.org/yearbook/2026. sipri.org. ta