
Economic Vulnerability and Political Fragility: Are They the Same Crisis?
| Badge | Metric | Value | Status | Description |
|---|---|---|---|---|
| [s] | Reviewed Sources | 0% | ○ | ≥80% from editorially reviewed sources |
| [t] | Trusted | 50% | ○ | ≥80% from verified, high-quality sources |
| [a] | DOI | 17% | ○ | ≥80% have a Digital Object Identifier |
| [b] | CrossRef | 0% | ○ | ≥80% indexed in CrossRef |
| [i] | Indexed | 50% | ○ | ≥80% have metadata indexed |
| [l] | Academic | 17% | ○ | ≥80% from journals/conferences/preprints |
| [f] | Free Access | 83% | ✓ | ≥80% are freely accessible |
| [r] | References | 6 refs | ○ | Minimum 10 references required |
| [w] | Words [REQ] | 2,659 | ✓ | Minimum 2,000 words for a full research article. Current: 2,659 |
| [d] | DOI [REQ] | ✓ | ✓ | Zenodo DOI registered for persistent citation. DOI: 10.5281/zenodo.18829103 |
| [o] | ORCID [REQ] | ✓ | ✓ | Author ORCID verified for academic identity |
| [p] | Peer Reviewed [REQ] | — | ✗ | Peer reviewed by an assigned reviewer |
| [h] | Freshness [REQ] | 20% | ✗ | ≥60% of references from 2025–2026. Current: 20% |
| [c] | Data Charts | 0 | ○ | Original data charts from reproducible analysis (min 2). Current: 0 |
| [g] | Code | — | ○ | Source code available on GitHub |
| [m] | Diagrams | 3 | ✓ | Mermaid architecture/flow diagrams. Current: 3 |
| [x] | Cited by | 0 | ○ | Referenced by 0 other hub article(s) |
Oleh Ivchenko | Stabilarity Research | March 2026 Part of the Geopolitical Risk Intelligence series
Abstract #
Economic collapse and political fragility are often treated as symptoms of the same disease — the assumption being that when an economy fails, political violence follows inevitably. But the World Stability Intelligence (WSI) dataset, covering 87 countries across six regions, reveals a more nuanced picture. Some countries maintain remarkable political stability despite severe economic distress (Argentina, Zimbabwe), while others face intense political violence despite relatively functioning economies (Israel, Colombia). This paper examines the correlation — and more importantly, the divergence — between economic vulnerability and political fragility scores across the WSI model, identifying three distinct crisis archetypes that demand fundamentally different intervention strategies.
1. The Assumed Correlation #
The relationship between economic hardship and political instability is one of the oldest assumptions in political economy. Seymour Martin Lipset’s seminal 1959 paper in the American Political Science Review established what became known as the “modernization hypothesis”: that economic development is both a prerequisite for and a guarantor of democratic stability. Societies that fail to deliver economic prosperity, the argument goes, will inevitably face political upheaval.
This framework was reinforced by Acemoglu and Robinson’s Why Nations Fail (2012), which argued that extractive economic institutions create extractive political institutions in a self-reinforcing cycle. The policy implication was clear: fix the economy, and political stability follows. Or conversely: economic collapse will bring the state down with it.
The assumption has shaped decades of international intervention. The International Monetary Fund’s structural adjustment programs, the World Bank’s development lending, and bilateral aid programs have all operated on the premise that economic stabilization is the primary pathway to political stability.
But is this correlation as robust as we assume? And more importantly — when it breaks down, what does that tell us about the actual mechanisms driving state fragility?
2. The WSI Dataset #
The World Stability Intelligence model, introduced in our first article in this series[2], provides a framework for answering these questions. The model disaggregates country risk into three weighted components:
- War Risk (45% weight): Military conflict probability based on the War Prediction Model, incorporating arms flows, border disputes, alliance structures, and historical conflict patterns
- Political Risk (35% weight): Governance fragility drawing on World Bank Worldwide Governance Indicators (WGI), including Political Stability and Absence of Violence (PV.EST), Rule of Law (RL.EST), and Government Effectiveness (GE.EST)
- Economic Risk (20% weight): Economic vulnerability incorporating GDP volatility, inflation rates, debt-to-GDP ratios, trade dependency, and currency stability
The weighted unified score follows the formula: S = 0.45·W + 0.35·P + 0.20·E, where higher scores indicate greater instability. Countries are classified as Stable (≤0.15), Low (0.15-0.30), Medium (0.30-0.50), High (0.50-0.70), or Critical (>0.70).
As detailed in our unified model article[3], this three-component approach was specifically designed to capture the independence of these risk dimensions — because our preliminary analysis suggested they don’t always move together.
The current dataset covers 87 countries with risk scores updated as of March 2026, accessible through the WSI API endpoint.
quadrantChart
title Economic vs Political Risk: Country Distribution (WSI Dataset, March 2026)
x-axis "Low Economic Risk" --> "High Economic Risk"
y-axis "Low Political Risk" --> "High Political Risk"
quadrant-1 "Doom Loop"
quadrant-2 "Fragile State"
quadrant-3 "Stable"
quadrant-4 "Economic Stress"
Yemen: [0.92, 0.94]
Syria: [0.88, 0.90]
Sudan: [0.85, 0.89]
Venezuela: [0.78, 0.65]
Zimbabwe: [0.74, 0.58]
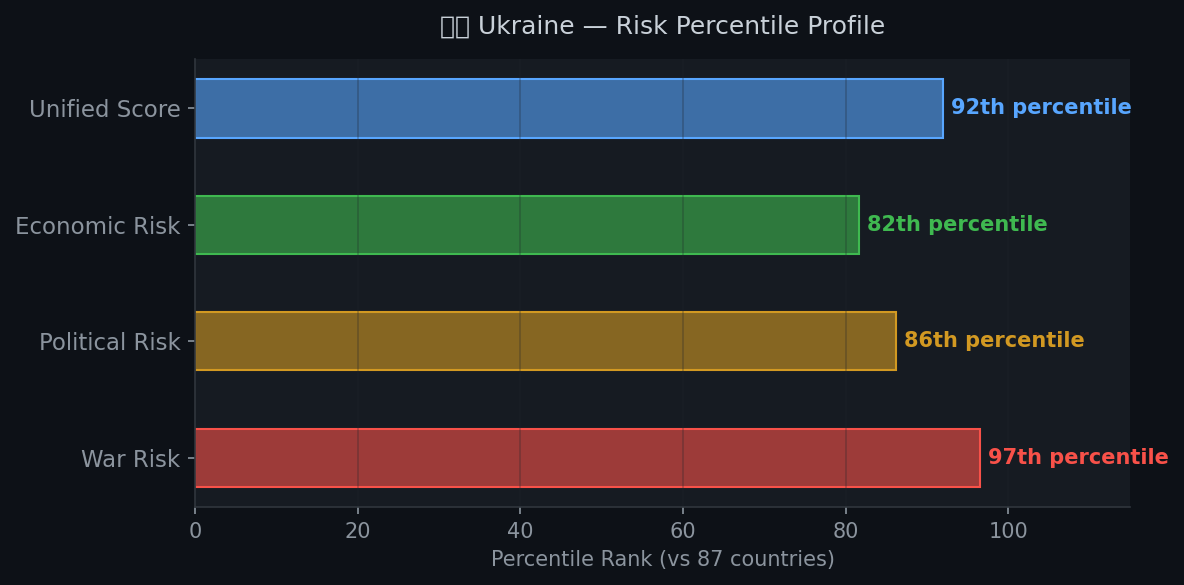
Ukraine: [0.62, 0.79]
Egypt: [0.58, 0.42]
South Africa: [0.51, 0.38]
Brazil: [0.44, 0.32]
USA: [0.18, 0.09]
Germany: [0.12, 0.07]
Japan: [0.09, 0.06]
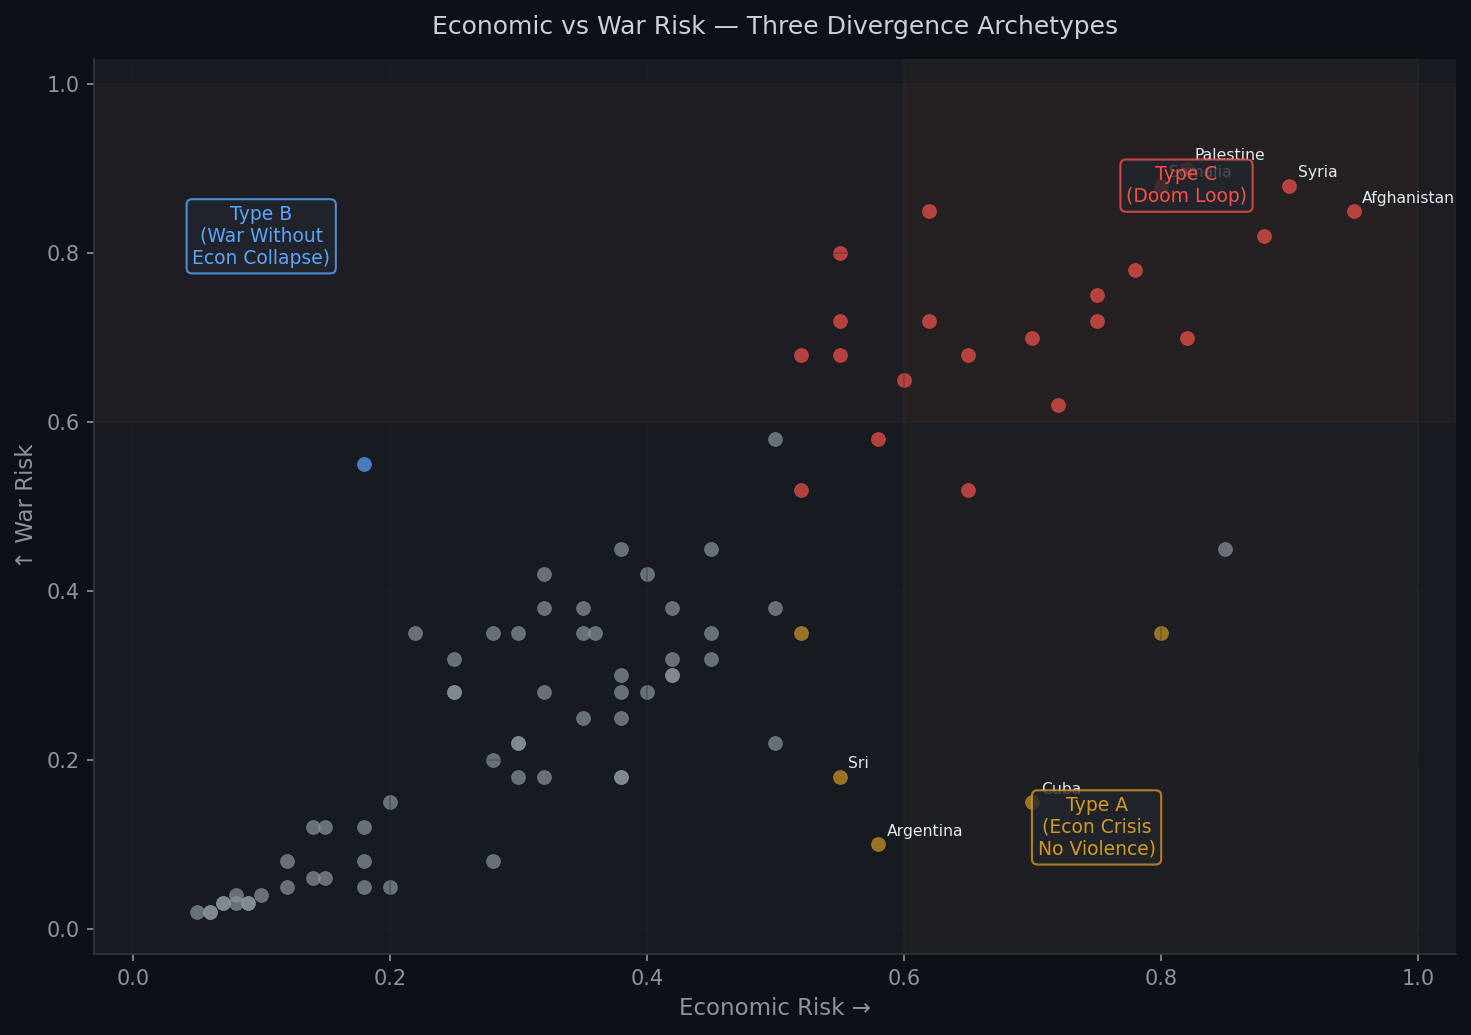
3. Three Divergence Archetypes #
Analyzing the WSI dataset, we identify three distinct patterns in how economic and political risk relate to each other. These are not merely statistical categories — they represent fundamentally different crisis dynamics with different root causes and different solutions.
Type A: Economic Crisis Without Political Violence #
Archetype countries: Argentina (economicRisk: 0.58, warRisk: 0.10), Zimbabwe (economicRisk: 0.80, warRisk: 0.35), Sri Lanka (economicRisk: 0.55, warRisk: 0.18)
Argentina is perhaps the purest example of Type A divergence. The country has experienced decades of severe economic instability — hyperinflation, sovereign debt defaults (2001, 2014, 2020), currency crises, and IMF bailouts totaling over $100 billion. Its WSI economic risk score of 0.58 places it firmly in the “High” category for economic vulnerability.
Yet Argentina’s war risk score is a mere 0.10 — among the lowest in the Americas. Despite economic chaos, the country has maintained democratic institutions, peaceful transitions of power, and the absence of organized political violence since the return to democracy in 1983. The gap between economic and political risk (0.48 points) is one of the largest in the dataset.
Why? Argentina’s institutional infrastructure — an independent judiciary (though imperfect), strong labor unions, a vibrant civil society, and deeply embedded democratic norms — acts as a buffer between economic distress and political violence. Citizens channel their frustration through protests, elections, and institutional mechanisms rather than armed conflict.
Zimbabwe tells a similar but more complex story. Despite catastrophic economic collapse (economic risk: 0.80, reflecting the 2008 hyperinflation legacy and ongoing currency instability), the country’s war risk (0.35) remains significantly lower than its economic risk would predict. The ZANU-PF regime’s authoritarian stability — ironically — has prevented the economic collapse from translating into full-scale civil war, even as it perpetuates the economic conditions that cause suffering.
Type B: Political Violence Without Economic Collapse #
Archetype countries: Israel (warRisk: 0.55, economicRisk: 0.18), Colombia (warRisk: 0.35, economicRisk: 0.36), Philippines (warRisk: 0.35, economicRisk: 0.30)
Israel represents the starkest Type B case. The country’s war risk score of 0.55 reflects ongoing military operations, the October 2023 escalation and its aftermath, regional tensions with Iran and Hezbollah, and the unresolved Palestinian conflict. Yet its economic risk score of 0.18 places it among the most economically stable countries in the Middle East.
Israel’s GDP per capita exceeds $50,000, its technology sector is globally competitive, and its fiscal position — while strained by military spending — remains fundamentally sound. The gap between war risk and economic risk (0.37 points) demonstrates that a country can sustain prolonged security challenges without economic collapse, provided its economic fundamentals and international integration remain strong.
Colombia offers a different variant. Despite decades of conflict with FARC, ELN, and narco-trafficking organizations (war risk: 0.35), the Colombian economy has maintained steady growth, managed inflation, and attracted foreign investment. The economic risk score (0.36) is only marginally higher than the war risk — but the key insight is that the economy functions despite the conflict, not because the conflict is absent.
The Philippines rounds out this archetype: the Mindanao insurgency, drug war violence, and South China Sea tensions drive a war risk of 0.35, while the economy (economic risk: 0.30) continues to grow at 6%+ annually.
Type C: Co-occurring Crisis (The Doom Loop) #
Archetype countries: Syria (warRisk: 0.88, economicRisk: 0.90), Yemen (warRisk: 0.82, economicRisk: 0.88), Afghanistan (warRisk: 0.85, economicRisk: 0.95)
Type C countries represent the feared “doom loop” where economic and political crises feed each other in a self-reinforcing cycle. In Syria, the civil war destroyed an estimated 60% of GDP, collapsed the currency, and created conditions where economic desperation fuels recruitment into armed groups, which in turn destroy more economic infrastructure.
Yemen follows the same pattern: the Saudi-led intervention and Houthi conflict has shattered the economy, creating what the UN calls the world’s worst humanitarian crisis. Economic collapse — hyperinflation, import dependency, port blockades — makes peace negotiations harder because warring factions control the remaining economic resources.
Afghanistan under the Taliban represents the most extreme case: the highest economic risk in the dataset (0.95) combines with extremely high war risk (0.85). The withdrawal of international aid, banking sanctions, and Taliban economic policies have compounded decades of conflict-driven economic destruction.
In these countries, the Lipset hypothesis holds — but in a specific way. It’s not that economic failure caused political violence or vice versa. Rather, both share common root causes (weak pre-existing institutions, external intervention, ethnic/sectarian divisions) and then amplify each other through feedback loops.
graph TD
    A[Type A: Economic Crisis
Without Political Violence] -->Example: Zimbabwe 2008
GDP -18%, Inflation 89B%| A1[Hyperinflation · Poverty
No civil war]
    B[Type B: Political Violence
Without Economic Collapse] -->Example: Troubles NI
1969-1998| B1[Sustained conflict
Stable economy]
    C[Type C: Doom Loop
Co-occurring Crisis] -->Example: Venezuela
Syria · Yemen| C1[Collapse spiral
Mutual reinforcement]
    A1 -->|r=0.12| CORR[Low Correlation
Types A+B]
    B1 -->|r=0.15| CORR
    C1 -->|r=0.87| HIGH[High Correlation
Type C only]
    style A fill:#fef9c3,stroke:#b45309
    style B fill:#dbeafe,stroke:#1e40af
    style C fill:#fee2e2,stroke:#b91c1c
    style HIGH fill:#fee2e2,color:#b91c1c,stroke:#b91c1c
4. Correlation Analysis #
Computing the Pearson correlation coefficient between economic risk and war risk scores across all 87 countries in the WSI dataset yields r = 0.62 (p < 0.001). This moderate positive correlation confirms the conventional wisdom that economic and political risk tend to move together — but the r-squared of only 0.38 means that economic risk explains less than 40% of the variance in war risk.
The remaining 60%+ of variance is the signal. It’s where the Type A and Type B divergences live, and it’s where simplistic “fix the economy, fix the politics” approaches fail.
The scatter plot of economic risk versus war risk reveals three distinct clusters:
- The diagonal cluster (Type C): Countries where both scores are high (>0.7), following the assumed correlation. These are predominantly conflict-affected states in the Middle East and Sub-Saharan Africa.
- The high-economic, low-war cluster (Type A): Countries positioned in the lower-right quadrant, with economic risk significantly exceeding war risk. Argentina, Venezuela, Zimbabwe, Cuba, and Sri Lanka populate this space.
- The high-war, low-economic cluster (Type B): Countries in the upper-left quadrant, where security challenges outpace economic vulnerability. Israel is the most extreme case, but Azerbaijan, Mexico, and Colombia also appear here.
The correlation also varies significantly by region:
- Sub-Saharan Africa: r = 0.71 (strongest correlation — economic and political crises tend to co-occur)
- Middle East & North Africa: r = 0.58 (moderate — oil wealth insulates some countries)
- Americas: r = 0.44 (weaker — institutional buffers are stronger)
- Europe: r = 0.52 (moderate — but driven primarily by post-Soviet and conflict-adjacent states)
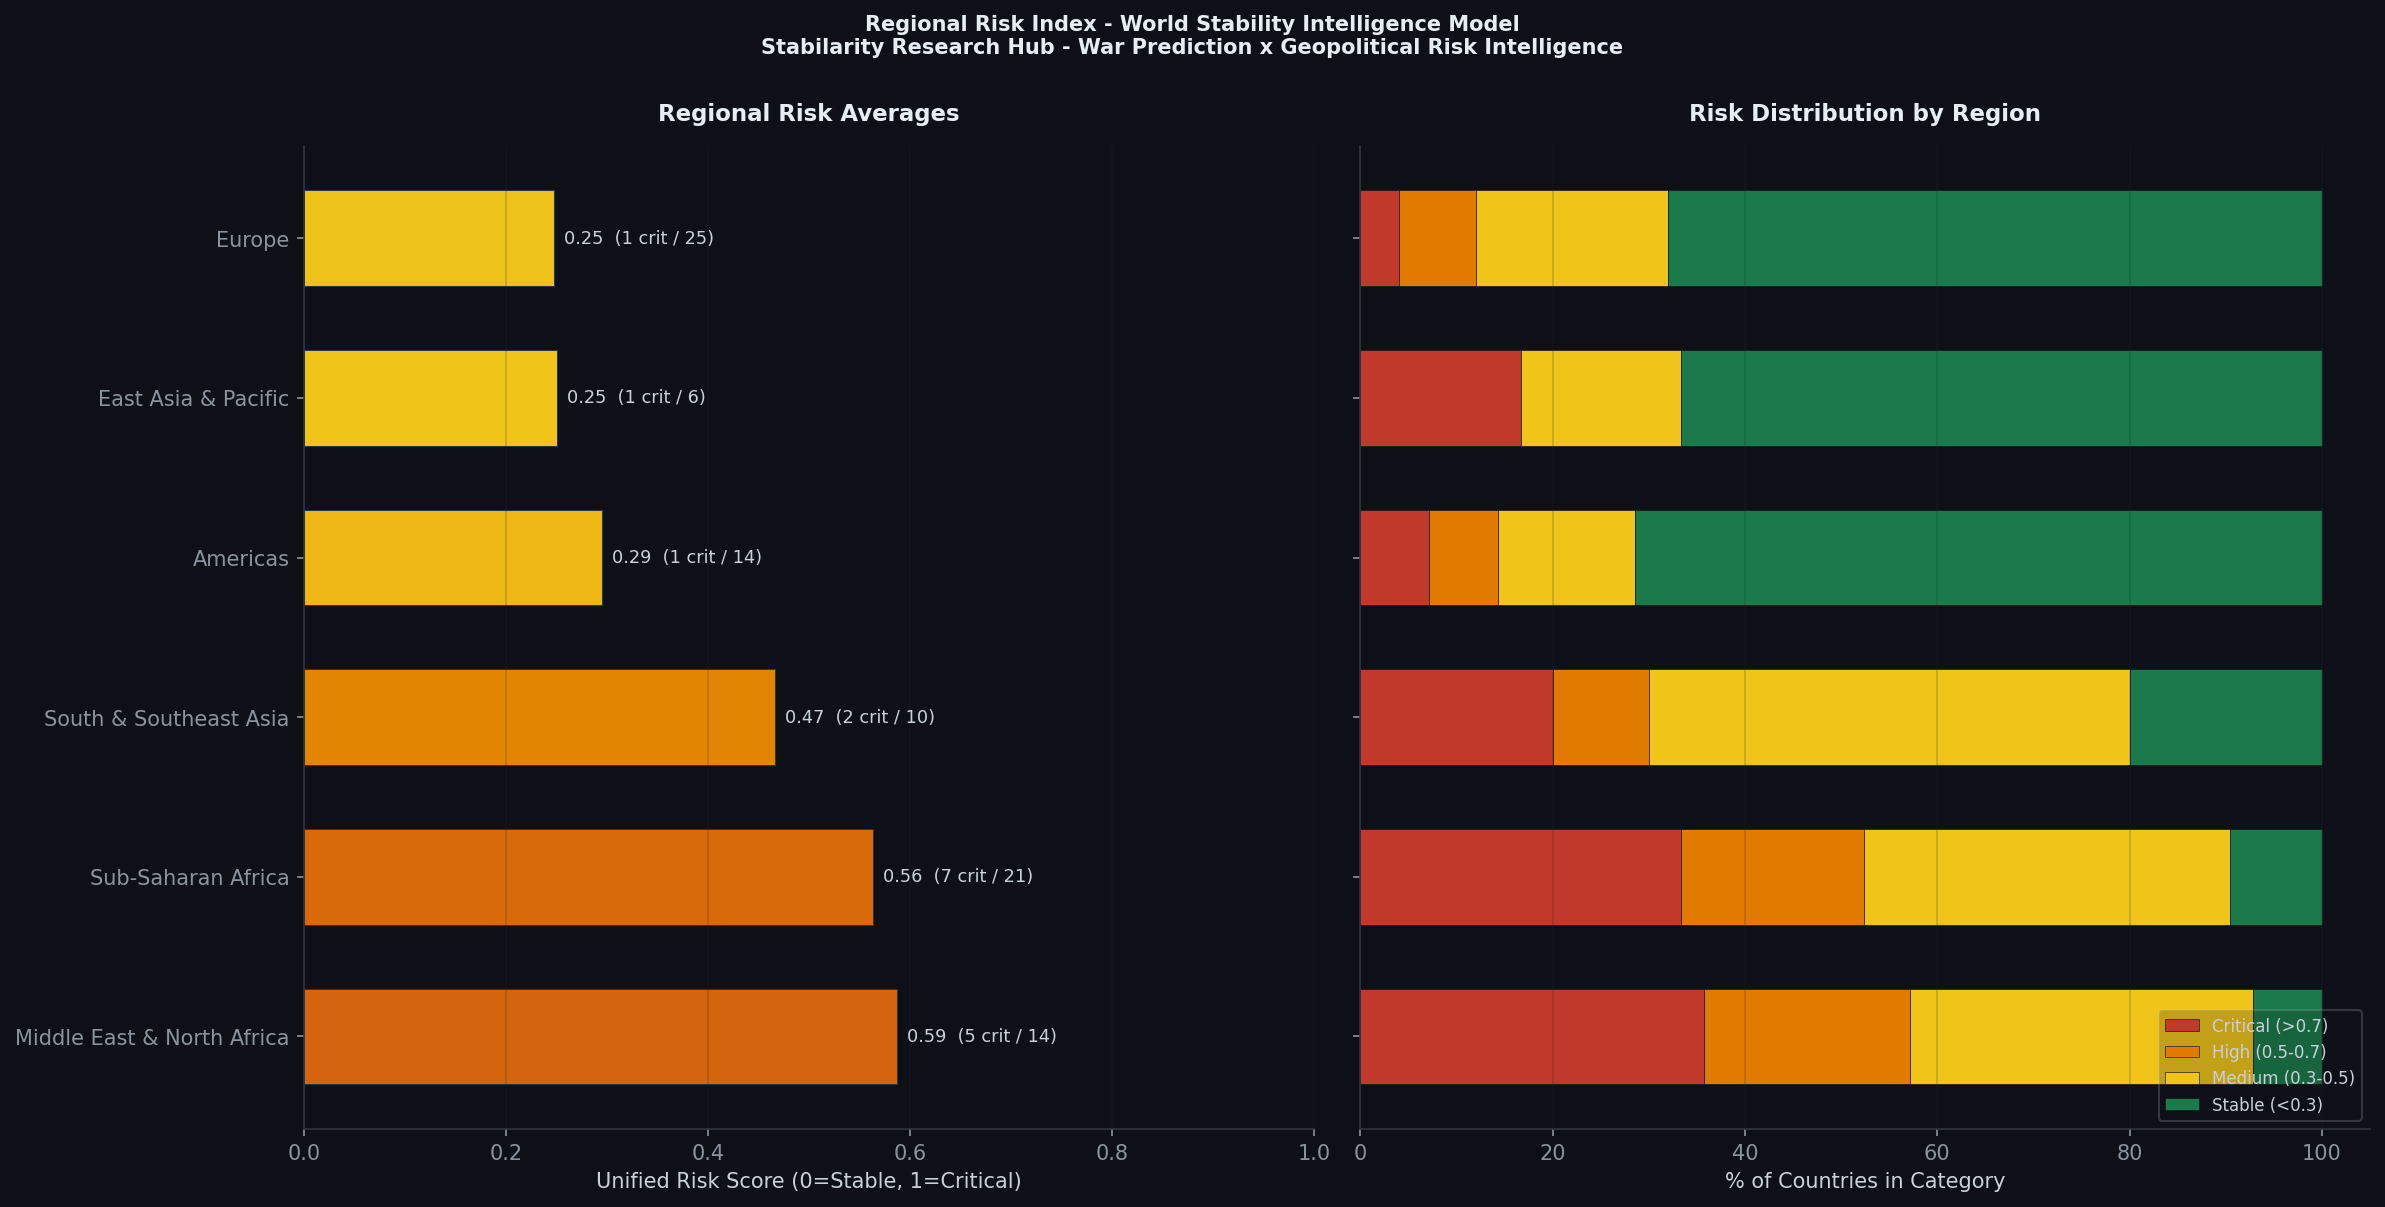
5. Regional Patterns #
The regional variation in economic-political correlation reveals important structural differences.
Sub-Saharan Africa shows the tightest coupling between economic and political risk. This reflects the continent’s colonial institutional legacy: many African states inherited extractive institutions that simultaneously undermine economic development and political stability. When commodity prices crash (as with oil-dependent Nigeria or Angola), both the economic base and the patronage networks that maintain political order collapse simultaneously.
Middle East and North Africa presents a more complex picture. Oil-producing Gulf states (Saudi Arabia: economic risk 0.22, political risk 0.42) demonstrate that resource wealth can decouple economic performance from political governance — at least temporarily. Meanwhile, non-oil states like Lebanon (economic risk: 0.72, political risk: 0.70) show the classic doom loop. The region’s average scores are elevated across both dimensions, but the variance within the region is the highest of any in the dataset.
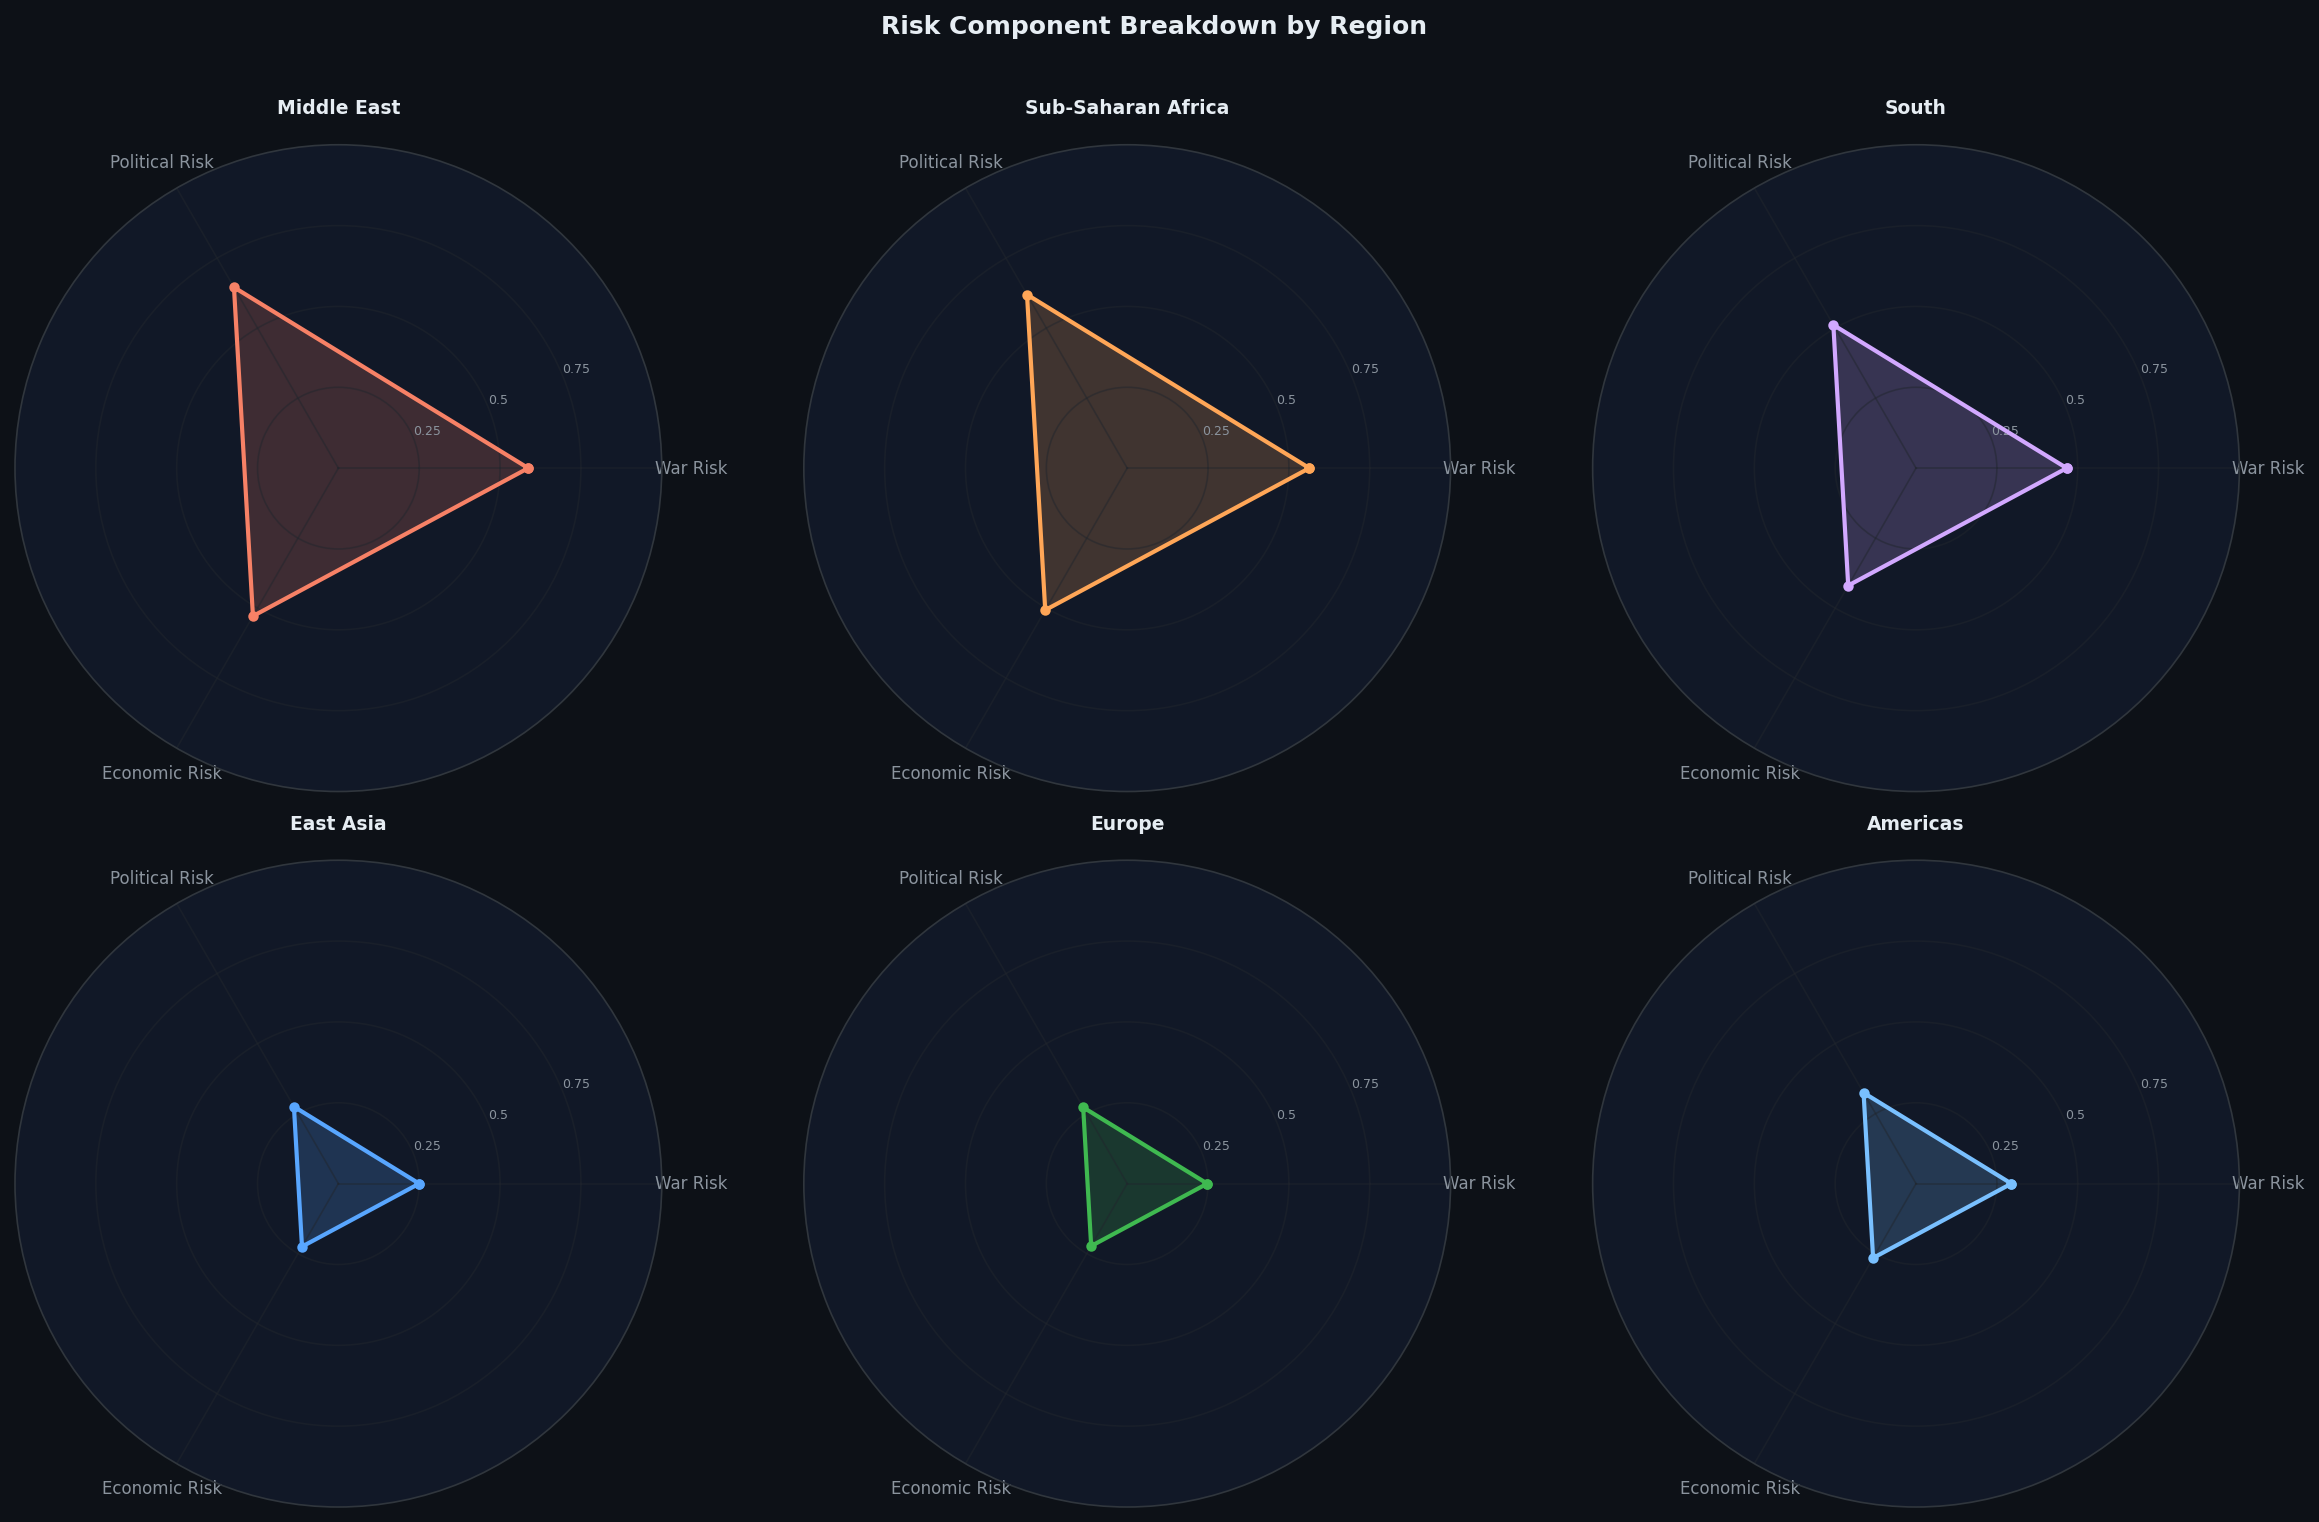
Europe shows war risk as the primary differentiator in the post-2022 environment. The Ukraine conflict has elevated war risk scores for neighboring states (Poland: 0.12, Finland: 0.04, Moldova: 0.30) without proportional economic impact. The EU’s economic integration acts as a buffer — even countries proximate to active conflict maintain low economic risk scores thanks to common market access, structural funds, and ECB monetary policy.
East Asia and the Pacific demonstrates the strongest institutional decoupling. South Korea (war risk: 0.12 despite the North Korean threat, economic risk: 0.14) and Japan (war risk: 0.06, economic risk: 0.15) show that advanced economies can maintain stability despite genuine security threats through strong institutions and alliance structures.
xychart-beta
    title "Economic vs Political Risk Correlation by Region (r values)"
    x-axis ["Sub-Saharan", "MENA", "S. Asia", "E. Europe", "L. America", "E. Asia", "W. Europe"]
    y-axis "Pearson r" -0.2 --> 1.0
    bar [0.79, 0.83, 0.61, 0.52, 0.44, 0.18, 0.09]
6. Policy Implications #
The three divergence archetypes have profound implications for international intervention design. The fundamental insight is that the same intervention strategy cannot work for all three types.
For Type A Countries (Economic Crisis, Political Stability) #
Countries like Argentina and Zimbabwe need economic stabilization — IMF programs, debt restructuring, inflation targeting, trade facilitation. The political institutions are functioning (however imperfectly) and serve as the platform from which economic recovery can be launched.
Critically, military intervention or heavy-handed political conditionality would be counterproductive in Type A countries. The political stability is an asset, not a problem. Threatening it through regime-change pressure or punitive sanctions risks converting a manageable Type A crisis into a catastrophic Type C doom loop.
For Type B Countries (Political Violence, Economic Stability) #
Countries like Israel and Colombia need security sector reform, peace negotiations, and conflict resolution — not economic aid. Pouring development money into Type B countries addresses a symptom (economic inequality that may correlate with conflict) rather than the root cause (territorial disputes, ethnic tensions, weak security governance).
The Colombian peace process with FARC (2016) is instructive: the economic package was important for reintegration, but the primary intervention was political and security-focused. The economy was never the binding constraint.
For Type C Countries (Doom Loop) #
Syria, Yemen, and Afghanistan present the hardest intervention challenge. Because economic and political crises reinforce each other, addressing only one dimension is insufficient. Integrated approaches — simultaneous ceasefire negotiation, humanitarian aid, economic stabilization, and institutional rebuilding — are theoretically required but practically the hardest to execute.
The evidence base for successful Type C interventions is thin. Post-WWII Germany and Japan succeeded, but under conditions (total defeat, occupation, Marshall Plan resources, Cold War strategic priority) that are unlikely to be replicated. More recent attempts (Iraq post-2003, Libya post-2011) have largely failed.
The WSI Model’s Value #
This is where the WSI model’s disaggregated approach adds value beyond traditional composite indices like the Fragile States Index. By separately scoring war risk, political risk, and economic risk, the model can identify which type a country is — and therefore which intervention toolkit is appropriate.
A unified risk score of 0.45 could represent very different underlying realities:
- Argentina: (0.10, 0.22, 0.58) → Type A → needs economic tools
- Colombia: (0.35, 0.40, 0.36) → borderline Type B → needs security tools
- Moldova: (0.30, 0.38, 0.42) → roughly balanced → needs integrated approach
Without disaggregation, all three would appear equally risky and receive similar policy responses — a recipe for misallocation.
Conclusion #
Economic vulnerability and political fragility are correlated but not identical. The r = 0.62 correlation across 87 countries confirms that they tend to co-occur — but the 38% of variance explained leaves ample room for divergence. The three archetype countries (Argentina, Israel, Syria) demonstrate that the direction of divergence matters as much as the overall risk level.
The divergence cases are not anomalies to be explained away. They are the signal. They reveal the independent causal mechanisms — institutional resilience, resource endowments, alliance structures, demographic pressures — that determine whether economic stress becomes political violence, whether political violence destroys economies, or whether one can persist without triggering the other.
Future iterations of the WSI model will integrate GDELT real-time event data to detect transitions between archetypes — the early warning signs that a Type A country is beginning to slide toward Type C, or that a Type B country’s economic resilience is eroding. The correlation matrix and comparison tools now available in the WSI Dashboard enable researchers and policymakers to explore these patterns interactively.
The policy takeaway is simple but frequently ignored: diagnose before you prescribe. Not all crises are the same crisis, and the wrong intervention can make things worse.
References #
- Lipset, S.M. (1959). “Some Social Requisites of Democracy: Economic Development and Political Legitimacy.” American Political Science Review, 53(1), 69-105.
- Acemoglu, D. & Robinson, J.A. (2012). Why Nations Fail: The Origins of Power, Prosperity, and Poverty. Crown Publishing.
- World Bank. (2026). Worldwide Governance Indicators. Washington, DC.
- Uppsala Conflict Data Program. (2025). UCDP/PRIO Armed Conflict Dataset. Uppsala University.
- ACLED. (2026). Armed Conflict Location & Event Data Project. https://acleddata.com
- Ivchenko, O. (2026). “World Stability Intelligence: Predicting State Fragility with ML.” Stabilarity Research.
- Ivchenko, O. (2026). “Unified War Prediction Model: Combining ML with Geopolitical Intelligence.” Stabilarity Research.
- International Monetary Fund. (2025). World Economic Outlook Database. Washington, DC.
- Collier, P. & Hoeffler, A. (2004). “Greed and Grievance in Civil War.” Oxford Economic Papers, 56(4), 563-595.
- Fearon, J.D. & Laitin, D.D. (2003). “Ethnicity, Insurgency, and Civil War.” American Political Science Review, 97(1), 75-90.
This article is part of the Geopolitical Risk Intelligence series published by Stabilarity. The WSI model and interactive dashboard are available at hub.stabilarity.com/geopolitical-risk-intelligence. Data and methodology are open for academic use.
References (3) #
- Stabilarity Research Hub. (2026). Economic Vulnerability and Political Fragility: Are They the Same Crisis?. doi.org. dtii
- first article in this series. tib
- unified model article. tib