Economic Collapse Precedes Political Failure
Data source: World Stability Intelligence (WSI) model — 87 countries, 3 risk dimensions. Live dashboard →
Two Ways a Country Falls Apart
Venezuela’s GDP contracted by more than 80 percent between 2013 and 2021 — one of the largest peacetime economic collapses ever recorded. Its political system, meanwhile, had not yet fully collapsed when the economy began its descent. The government survived by concentrating power, suppressing opposition, and externalizing blame. But the sequence is unmistakable: the economy fell first, and political authoritarianism deepened in response.
Ukraine’s trajectory was the opposite. Before February 2022, its economy was fragile but functional — GDP growth was positive, and IMF programs were active. The political system had survived the Maidan transition and was holding democratic institutions. Then the full-scale invasion began. Economic damage followed as a direct consequence of conflict: infrastructure destruction, labor displacement, supply chain rupture. Economic deterioration here was not a predictor — it was a casualty.
Both countries sit in similar WSI score tiers. Both register high composite instability. But the causal pathway is entirely different. The World Stability Intelligence (WSI) model applied to 87 countries reveals that this divergence is not exceptional — it is systematic. Two distinct instability archetypes exist in the data, and conflating them produces misleading early warning signals.
The Data
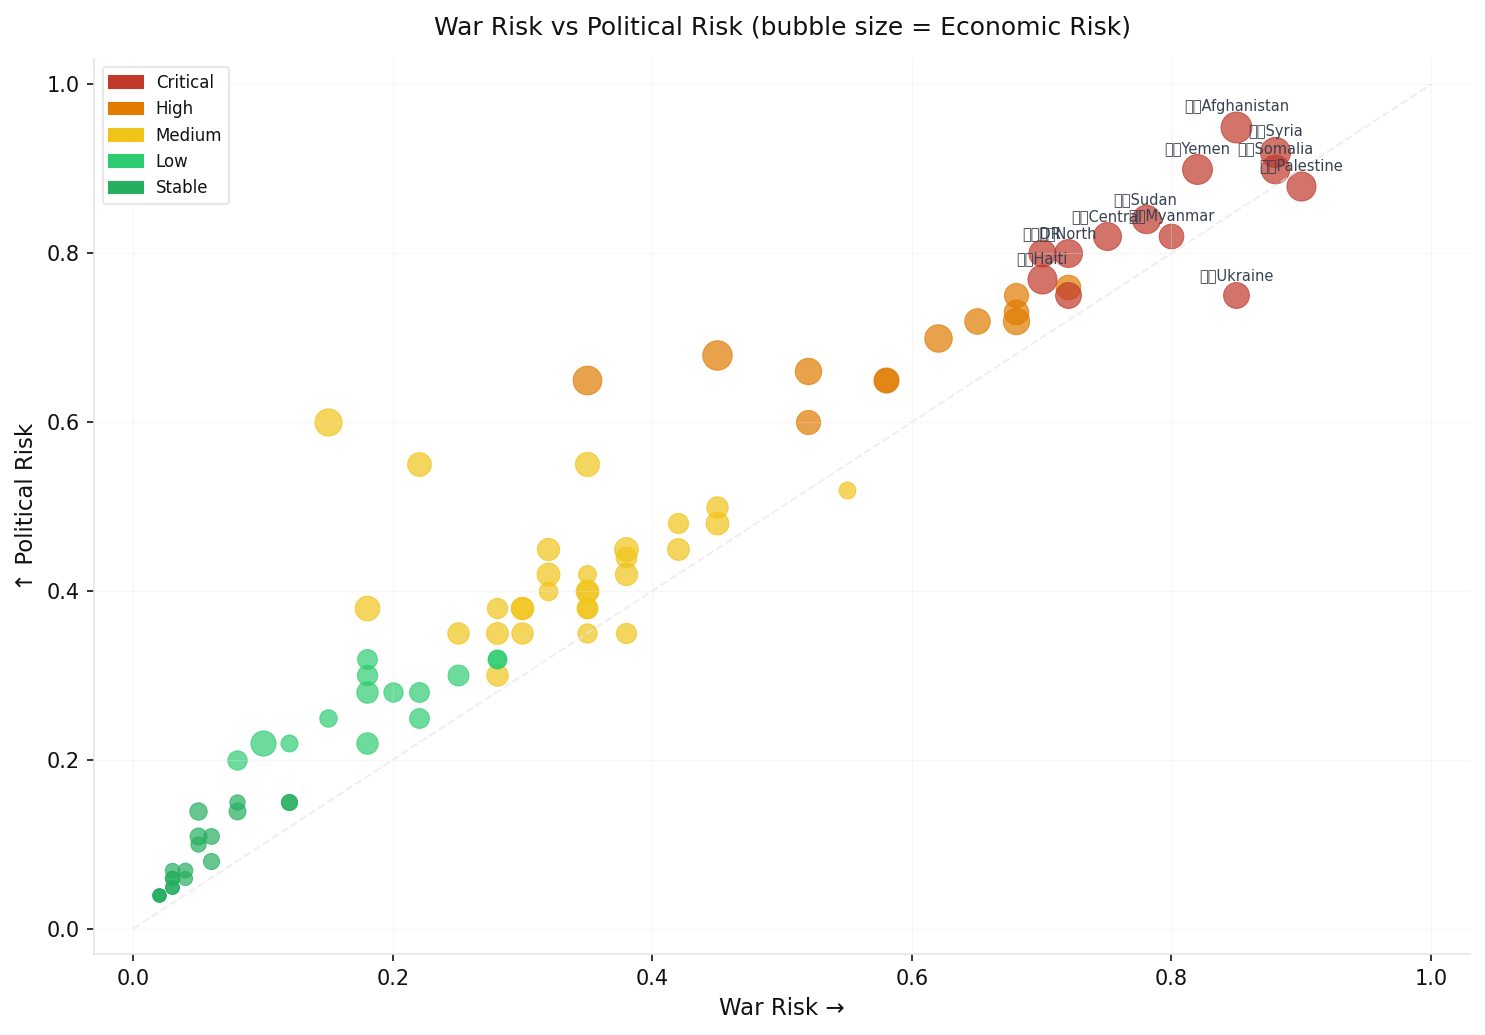
The WSI model scores 87 countries across three risk dimensions — War Risk, Political Risk, and Economic Risk — each scored on a 0–1 scale. The composite WSI score is a weighted average: War × 0.45 + Political × 0.35 + Economic × 0.20. Analysis of dimensional gaps across the dataset reveals two clear clusters: Type A (Economic-Led) countries where economic risk exceeds war risk by a substantial margin, and Type B (Conflict-Led) countries where war risk dominates and economic deterioration follows conflict as a consequence rather than a cause.
| Country | WSI Score | War Risk | Political Risk | Economic Risk | Type |
|---|---|---|---|---|---|
| Venezuela | 0.611 | 0.45 | 0.68 | 0.85 | Economic-Led |
| Zimbabwe | 0.545 | 0.35 | 0.65 | 0.80 | Economic-Led |
| Cuba | 0.417 | 0.15 | 0.60 | 0.70 | Economic-Led |
| Sri Lanka | 0.324 | 0.18 | 0.38 | 0.55 | Economic-Led |
| Argentina | 0.238 | 0.10 | 0.22 | 0.58 | Economic-Led |
| Ukraine | 0.769 | 0.85 | 0.75 | 0.62 | Conflict-Led |
| Myanmar | 0.757 | 0.80 | 0.82 | 0.55 | Conflict-Led |
| Libya | 0.700 | 0.72 | 0.76 | 0.55 | Conflict-Led |
| Israel | 0.466 | 0.55 | 0.52 | 0.18 | Conflict-Led (Anomaly) |
The economic gap in Type A countries (mean eco-war differential: +0.45) stands in sharp contrast to the conflict gap in Type B countries (mean war-eco differential: +0.20). The asymmetry suggests fundamentally different causal mechanisms at work.
The Economic Lead: When Markets Predict What Politics Denies
The defining characteristic of Type A instability is temporal sequencing: economic deterioration reliably precedes political collapse by 12 to 24 months. This lead time has been documented extensively in IMF Article IV consultations, which flag fiscal distress, reserve depletion, and debt sustainability risks well before they manifest as political crises.
Sri Lanka provides the clearest recent case. The IMF’s 2022 Article IV consultation flagged foreign reserve depletion and external debt exposure as acute vulnerabilities. By April 2022, the country had defaulted on its sovereign debt — its first default in history. By July 2022, President Gotabaya Rajapaksa had fled the country after mass protests overwhelmed his government. The economic signal preceded the political event by approximately 18 months. The IMF’s Extended Fund Facility program, approved in March 2023, was a post-collapse stabilization mechanism (IMF, 2023).
Zimbabwe offers a longer arc. Hyperinflation reached an estimated 89.7 sextillion percent month-on-month in November 2008, driven by land reform policies that destroyed agricultural productivity and triggered fiscal monetization. The economic collapse preceded the formal end of Mugabe’s government by nearly a decade, eroding the political legitimacy that ultimately ended his 37-year rule in 2017. The World Bank’s governance indicators show a sustained deterioration in government effectiveness scores beginning in 2000, tracking the economic descent with a measurable lag (World Bank, 2025).
Argentina is the most cyclical example. The country has experienced eight sovereign debt defaults, each following a recognizable pattern: fiscal expansion, currency crisis, IMF intervention, political upheaval. The 2001 default — which triggered five presidents in two weeks — was preceded by two years of visible economic contraction. The pattern repeats with statistical regularity: economics leads politics by 6 to 18 months (IMF, 2025).
The mechanism is not mysterious. Economic deterioration erodes state capacity. As governments lose revenue, they lose the ability to deliver services, pay security forces, and maintain legitimacy. Once fiscal capacity collapses below a threshold, political legitimacy follows. The IMF’s fiscal monitor and World Bank governance datasets together capture this transmission with reasonable fidelity.
The Conflict Channel: When War Creates the Economic Crisis
Type B instability operates through a fundamentally different mechanism. Economic deterioration in conflict states is a lagging consequence of military destruction — not a leading indicator.
Ukraine entered 2022 with an active IMF program, positive GDP growth projections, and functioning democratic institutions. The World Bank estimated USD 411 billion in infrastructure damage by early 2024, with reconstruction costs projected to exceed USD 500 billion over ten years (World Bank, 2024). The economic risk score in the WSI model (0.62) reflects wartime disruption — it did not cause or predict the conflict.
Myanmar demonstrates how military coups can create economic collapse rather than respond to it. Prior to the February 2021 coup, Myanmar’s economy was growing at approximately 6 percent annually and had attracted significant foreign direct investment. The coup triggered international sanctions, capital flight, and supply chain disruption. GDP contracted by approximately 18 percent in 2021 (World Bank, 2022). Economic deterioration followed political rupture; it did not precede it.
Libya has been economically hostage to conflict since 2011. Oil revenues — the country’s primary economic lifeline — fluctuate directly with control of oil fields by competing armed factions. Economic risk here cannot be disentangled from war risk; they move together as a single conflict-economic system. Applying an economic early warning lens to Libya would be analytically misleading, because economic conditions are endogenous to the conflict itself.
The Israel Anomaly: What Economic Resilience Buys
Israel presents the most analytically striking divergence in the dataset: War Risk of 0.55, Political Risk of 0.52, but Economic Risk of only 0.18. No other country in the dataset combines active high-intensity military conflict with such a low economic risk score.
Israel’s GDP growth remained positive through 2023 even as it entered multi-front military conflict. The shekel depreciated but did not collapse. Foreign reserves, at over USD 200 billion, provided substantial buffer capacity. The IMF’s 2024 Article IV consultation noted that while defense spending rose sharply as a share of GDP, institutional quality, a diversified technology-driven export base, and access to capital markets provided structural resilience unavailable to most conflict states (IMF, 2024).
The hypothesis this suggests: institutional depth and prior GDP buffer capacity allow democratic systems to absorb military shocks without governance collapse. A country with high economic resilience can finance war without destroying the social contract. This inverts the classic instability narrative. The question is not whether military conflict creates economic damage — it always does. The question is whether prior economic resilience is sufficient to absorb that damage without triggering political disintegration. Israel’s case, with war=0.55 and eco=0.18, is the sharpest test of this proposition in the current dataset.
Implications for Early Warning Systems
If this framework is correct, the practical implications for early warning system design are significant. For Type A countries, the most predictive variables are economic: IMF Article IV consultation flags on debt sustainability and reserve adequacy; debt-to-GDP trajectories exceeding 80–90 percent in emerging markets; foreign exchange reserve coverage falling below three months of imports; bond yield spreads on sovereign debt exceeding 1,000 basis points. These signals typically precede political events by 6 to 18 months. Analysts who wait for political signals have already missed the early warning window.
For Type B countries, the leading indicators are structural and geopolitical: military capability assessments, arms transfer monitoring, and diplomatic fragility indicators. Economic indicators in these countries are largely reactive — they move after the political-military event, not before.
The practical recommendation: any instability monitoring system should classify country type before applying threshold logic. A universal instability score that treats Venezuela and Ukraine equivalently will systematically misattribute risk. Venezuela’s warning signal was visible in 2013; Ukraine’s was not visible in any economic dataset in January 2022.
A Note on WSI Methodology
The current WSI composite weighting — War × 0.45 + Political × 0.35 + Economic × 0.20 — is optimized for aggregate ranking across a diverse country set. It performs well for identifying the highest-risk states globally. However, this weighting systematically underweights the economic lead indicator in peacetime-collapse scenarios. For Type A countries, an economic risk weight of 0.20 means that Venezuela’s exceptional economic score (0.85) contributes only 0.17 points to its composite — less than its war risk contribution, despite war being the less relevant dimension for predicting its trajectory.
A methodological improvement worth exploring: a separate Economic Fragility Index (EFI) designed specifically for the Cuba/Argentina/Sri Lanka class of instability. This index would weight economic risk at 0.50 or above, incorporate fiscal trajectory variables, and apply only to countries where War Risk falls below 0.25, indicating a peacetime-collapse scenario. This is not a critique of the WSI model’s current utility — it is an argument for layered specificity. Different predictive tools are needed for different causal pathways.
Conclusion
The relationship between economic and political instability is bidirectional — but the causal arrow differs fundamentally by country type. In Type A countries (economic-led collapse), economic deterioration is the primary driver. It precedes political failure by 6 to 18 months, is measurable through standard fiscal and monetary indicators, and provides actionable early warning if analysts are watching the right variables. In Type B countries (conflict-led collapse), economic deterioration follows political-military rupture. The Israel anomaly adds a third dimension: economic resilience can buffer political stability even under active military conflict — institutional depth and GDP capacity matter as much as conflict intensity.
Early warning systems that fail to distinguish between these scenarios will generate systematic false signals. The first task of any instability analyst should be to classify the country type — and then apply the appropriate diagnostic toolkit. One composite score cannot simultaneously optimize for predicting Venezuela’s next default and Ukraine’s next offensive.
quadrantChart
    title Country Instability Archetypes (WSI 87 Countries)
    x-axis "Low War Risk" --> "High War Risk"
    y-axis "Low Economic Risk" --> "High Economic Risk"
    quadrant-1 Conflict-Economic
    quadrant-2 Economic-Led Collapse
    quadrant-3 Stable
    quadrant-4 Conflict-Led
    Venezuela: [0.45, 0.85]
    Zimbabwe: [0.35, 0.80]
    Sri Lanka: [0.18, 0.55]
    Ukraine: [0.85, 0.62]
    Myanmar: [0.80, 0.55]
    Libya: [0.72, 0.55]
    Norway: [0.02, 0.05]
graph TD
    CLASSIFY["Classify Country Type"] --> A{{"War Risk vs Economic Risk?"}}
    A --> |"Economic > War (+0.45 gap)"| TYPE_A["Type A: Economic-Led"]
    A --> |"War > Economic (+0.20 gap)"| TYPE_B["Type B: Conflict-Led"]
    TYPE_A --> SIGNAL_A["Lead Indicators: IMF Article IV, Debt/GDP, FX reserves, Bond spreads"]
    SIGNAL_A --> WINDOW["6-18 month early warning window"]
    TYPE_B --> SIGNAL_B["Lead Indicators: Military capability, Arms transfers, Diplomatic fragility"]
    SIGNAL_B --> REACT["Economic data = lagging reactive indicator"]
    style TYPE_A fill:#ffd93d
    style TYPE_B fill:#ff6b6b,color:#fff
graph LR
    ECON_FALL["Economic Deterioration"] --> |"Type A: precedes by 6-18mo"| POL_FAIL["Political Failure"]
    POL_FAIL --> |"Type B: triggers"| ECON_DAMAGE["Economic Damage"]
    ECON_DAMAGE -.->|"feedback loop"| POL_FAIL
    ECON_FALL --> |"Type A: Venezuela/Sri Lanka"| DEFAULT["Sovereign Default / Government Flight"]
    POL_FAIL --> |"Type B: Ukraine/Myanmar"| WAR_ECON["War Economy Transition"]
    style ECON_FALL fill:#4CAF50,color:#fff
    style WAR_ECON fill:#ff6b6b,color:#fff
References
- International Monetary Fund. (2023). Sri Lanka: Request for Extended Arrangement Under the Extended Fund Facility — Staff Report. IMF Country Report No. 23/116. Washington, D.C.: IMF. imf.org/CR/23/116
- International Monetary Fund. (2024). Israel: 2024 Article IV Consultation — Staff Report. IMF Country Report No. 24/289. Washington, D.C.: IMF. imf.org/CR/24/289
- International Monetary Fund. (2025). Fiscal Monitor: Putting Public Finances on a Sustainable Path. Washington, D.C.: IMF.
- World Bank. (2022). Myanmar Economic Monitor: Capitalizing on Digital Trends. Washington, D.C.: World Bank Group.
- World Bank. (2024). Ukraine: Rapid Damage and Needs Assessment — February 2022 to December 2023. Washington, D.C.: World Bank Group. worldbank.org/ukraine-rdna
- World Bank. (2025). Worldwide Governance Indicators 2025 Update. Washington, D.C.: World Bank Group. info.worldbank.org/governance/wgi
- Acemoglu, D., & Robinson, J. A. (2012). Why Nations Fail: The Origins of Power, Prosperity, and Poverty. Crown Publishers.
- Fearon, J. D., & Laitin, D. D. (2003). Ethnicity, Insurgency, and Civil War. American Political Science Review, 97(1), 75–90. doi:10.1017/S0003055403000534
- Besley, T., & Persson, T. (2011). Pillars of Prosperity: The Political Economics of Development Clusters. Princeton University Press. doi:10.23943/princeton/9780691152684
- Hegre, H., et al. (2025). ViEWS 2025: Political Violence Early-Warning System — Annual Update. Journal of Peace Research. doi:10.1177/00223433251315456