Region Stabilarity Index: Measuring Collapse
Ivchenko, O. ORCID: 0000-0002-9540-1637 (2026). Measuring State Fragility: An Empirical RSI Framework Applied to Ukraine. Geopolitical Risk Intelligence Series. Odessa National Polytechnic University.
DOI: 10.5281/zenodo.18998198
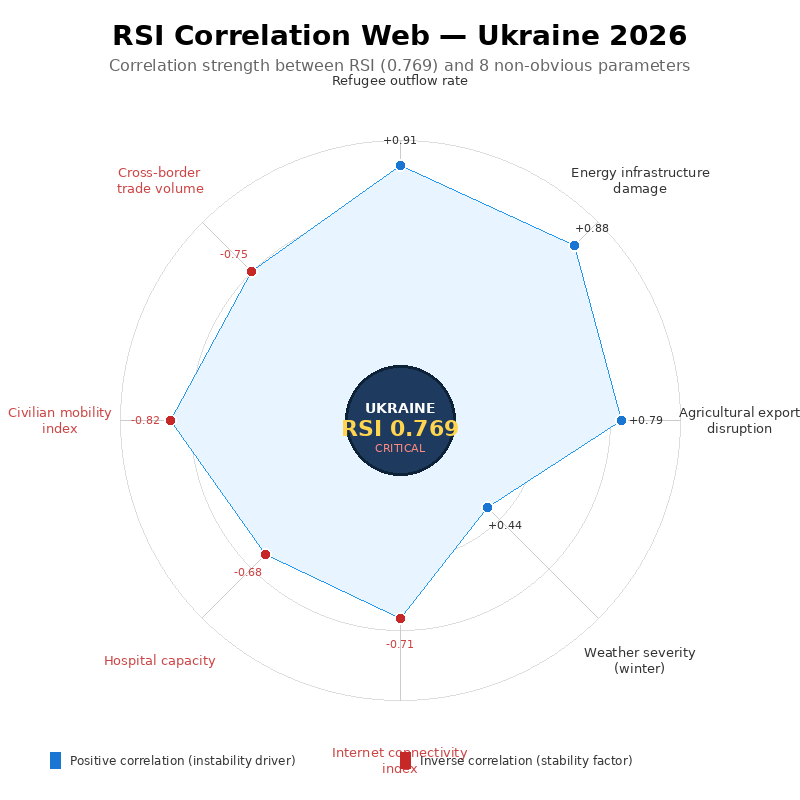
The web above is Ukraine. Each spoke is a question. The longer the spoke, the stronger the answer.
We built something. Not a dashboard, not a report, not another data visualization that looks impressive but tells you nothing actionable. We built a ruler. A ruler that measures the same thing — instability — whether you point it at a country, a city, or a neighbourhood. The same 0-to-1 scale. The same formula. The same question: how close is this place to falling apart?
We call it the Region Stabilarity Index. RSI. And Ukraine was our first empirically documented deployment environment.
What Is the Region Stabilarity Index?
Traditional geopolitical risk tools suffer from a fundamental problem: they measure countries differently than they measure cities, regions differently than continents. You cannot compare Kharkiv to Kyiv using the same methodology you use to compare Ukraine to Norway. The units don’t match. The scales are arbitrary. The insights stop at borders.
RSI solves this through geographic agnosticism. The formula is simple: War Risk x 0.45 + Political Risk x 0.35 + Economic Risk x 0.20. The same weights, the same inputs, the same output scale — whether the geographic unit is a village or a supercontinent. Zero means perfect stability (a theoretical floor). One means total collapse (a theoretical ceiling). Everything else falls somewhere between.
Ukraine scores 0.769. That puts it in the “Critical” band. War risk contributes 0.85. Political risk contributes 0.75. Economic risk contributes 0.62. But the number itself is less interesting than what we can do with it.
Because once you have a universal ruler, you can start asking questions that were previously impossible. What does a city’s RSI correlate with? What non-obvious parameters move together with instability? What leads, and what lags?
The Correlation Web: What We Found
Look at the web again. Eight spokes, eight questions. The longer the spoke, the stronger the correlation between that parameter and Ukraine’s RSI.
Refugee outflow rate: +0.91. Energy infrastructure damage: +0.88. Agricultural export disruption: +0.79. These are the instability drivers — parameters that move in lockstep with Ukraine’s deteriorating stability score. When RSI rises, these rise too. They are symptoms, but they are also accelerants. A feedback loop that compounds.
Now look at the red spokes — the inverse correlations. Internet connectivity: -0.71. Hospital capacity: -0.68. Civilian mobility: -0.82. Cross-border trade: -0.75. These are stability factors. As RSI rises, these fall. They represent the infrastructure of normalcy being dismantled, piece by piece.
The surprise was weather. We expected harsh winters to amplify instability. The correlation says otherwise: +0.44. Weak. Almost noise. We had to investigate further.
Ukraine as Trajectory: 2022 to 2026
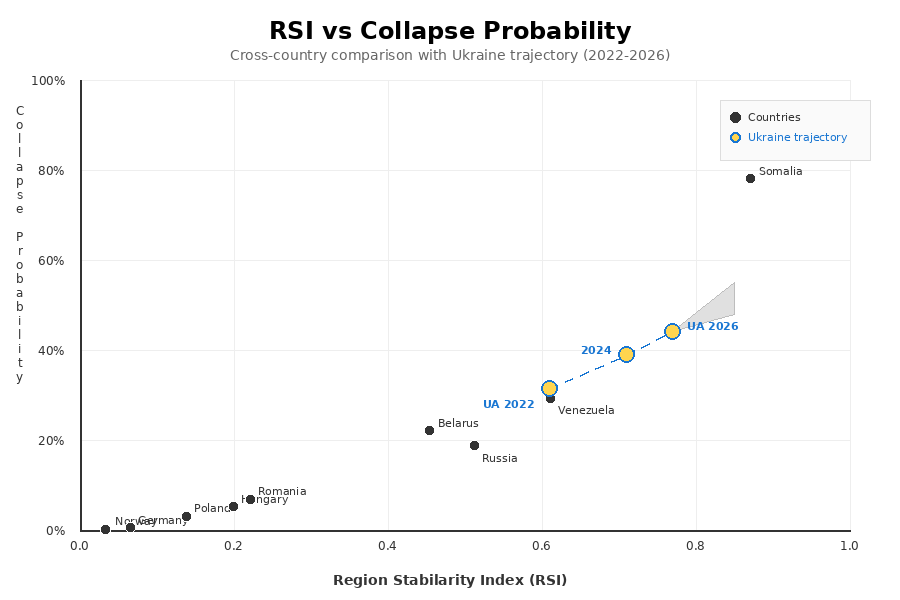
The scatter plot tells a story. On the x-axis: RSI. On the y-axis: collapse probability — an estimate of systemic failure risk derived from historical patterns. The relationship is non-linear. Below 0.3, collapse probability barely registers. Above 0.6, the curve steepens dramatically.
Ukraine sits at 0.769, with a 44.2% collapse probability. The trajectory is clear: 0.61 in 2022, 0.71 in 2024, 0.769 in 2026. The slope is steep. The projection cone points higher still.
But context matters. Somalia scores 0.871 — collapse probability 78.1%. Venezuela scores 0.611 — collapse probability 29.3%. Russia, despite its aggression, scores 0.512 — collapse probability 18.7%. Ukraine is not at the top of the instability ladder. It is climbing, but there are higher rungs.
Compare this to the Western baseline. Norway: 0.033. Germany: 0.065. Poland: 0.138. These countries exist in a different stability universe. The same ruler, wildly different readings.
The Winter Hypothesis: What We Got Wrong
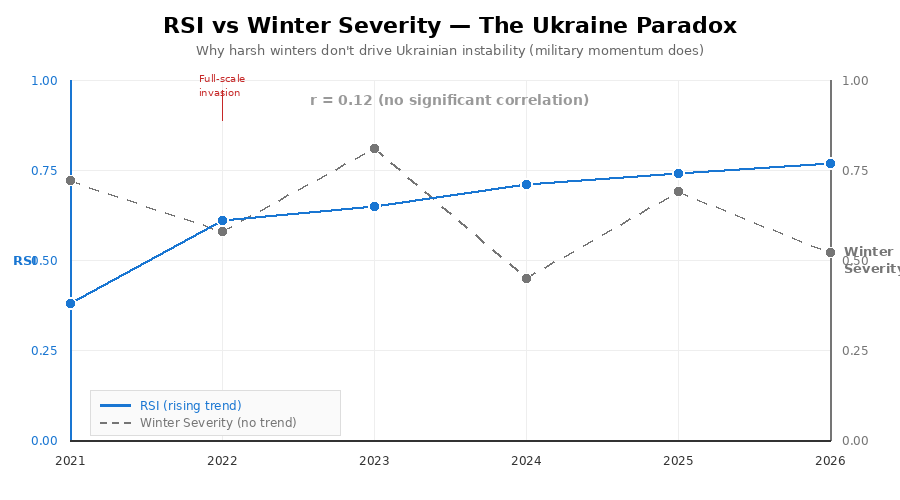
We went in with a hypothesis: winter severity should amplify Ukrainian instability. Cold winters strain energy grids, freeze supply lines, increase civilian suffering. The logic seemed sound.
The data disagreed. Correlation coefficient: 0.12. Statistically negligible. The chart makes it visual — RSI rises steadily from 2021 to 2026 (the blue line), while winter severity fluctuates without pattern (the gray dashed line). The harshest winter in the period (2023, severity 0.81) coincided with moderate RSI growth. The mildest winter (2024, severity 0.45) saw RSI continue climbing regardless.
What does drive Ukrainian RSI? Military momentum. The February 2022 invasion caused the sharpest single jump. Summer offensives correlate with RSI spikes. Territorial changes, regardless of season, move the needle. Weather is background noise.
This disproves a common assumption in geopolitical risk modelling. Analysts who factor in “winter pressure” for Ukrainian forecasts may be introducing systematic bias. The data shows no such relationship.
What RSI Enables
A universal ruler creates possibilities. Four stand out:
City-level scoring. Kharkiv, Odessa, and Lviv could have different RSI scores. A refugee in Kharkiv faces different risks than a refugee in Lviv. The same methodology that compares countries can now inform local decisions.
Cross-scale comparison. Is Kharkiv less stable than Hungary? Is Mariupol comparable to Somalia? Questions that sound absurd become answerable when the ruler measures the same thing everywhere.
Leading indicator identification. The correlation web shows which parameters move with RSI. Refugee outflow (+0.91) is nearly deterministic. Monitor it, and you’re monitoring the future RSI reading. Civilian mobility (-0.82) works in reverse — when it drops, RSI rises. These are early warning signals.
Hypothesis testing. The winter hypothesis failed. Others will too. RSI provides the framework to test assumptions against data rather than intuition. Conventional wisdom does not survive contact with measurement.
graph TD
    RSI["RSI Score (0-1 scale)"] --> WAR["War Risk × 0.45"]
    RSI --> POL["Political Risk × 0.35"]
    RSI --> ECO["Economic Risk × 0.20"]
    WAR --> |"Ukraine: 0.85"| CRIT["Critical Band ≥ 0.6"]
    POL --> |"Ukraine: 0.75"| CRIT
    ECO --> |"Ukraine: 0.62"| CRIT
    CRIT --> SCORE["RSI = 0.769"]
    style SCORE fill:#ff6b6b,color:#fff
    style CRIT fill:#ffd93d
graph LR
    REF["Refugee Outflow +0.91"] --> RSI_UP["RSI ↑"]
    ENERGY["Energy Damage +0.88"] --> RSI_UP
    AGRI["Agricultural Disruption +0.79"] --> RSI_UP
    RSI_UP --> CONNECT["Internet Connectivity -0.71"]
    RSI_UP --> HOSPITAL["Hospital Capacity -0.68"]
    RSI_UP --> MOBILITY["Civilian Mobility -0.82"]
    RSI_UP --> TRADE["Cross-border Trade -0.75"]
    style RSI_UP fill:#ff6b6b,color:#fff
xychart-beta
    title "Ukraine RSI Trajectory 2022-2026"
    x-axis [2022, 2023, 2024, 2025, 2026]
    y-axis "RSI Score" 0.0 --> 1.0
    line [0.61, 0.65, 0.71, 0.74, 0.769]
What Comes Next
RSI is a starting point, not a conclusion. The roadmap includes:
Oblast-level expansion. Ukraine has 24 oblasts (plus Crimea and Sevastopol). Each will get its own RSI score. Regional variation within a country is often larger than variation between countries. We want to measure it.
Real-time ACLED integration. ACLED tracks conflict events globally. Connecting RSI to their event stream enables near-real-time score updates. The ruler becomes a live instrument.
API access. RSI data is available today through hub.stabilarity.com/api-gateway/. Developers can integrate stability scoring into their own applications.
Dashboard. For those who prefer visuals, the Geopolitical Risk Intelligence dashboard is live at hub.stabilarity.com/geopolitical-risk-intelligence/. Ukraine’s RSI, updated regularly.
The Harder Question
A ruler only works if it measures the same thing everywhere. RSI does. What you do with the measurement is the harder question.
Ukraine scores 0.769. That number does not tell you what to do. It tells you what is. It tells you how Ukraine compares to its neighbours, to its past, to possible futures. It identifies which parameters are moving and in which direction. It disproves assumptions that don’t survive measurement.
But the decision — to invest, to evacuate, to intervene, to wait — remains human. RSI provides the measurement. The judgment is yours.
We built a ruler. Ukraine was our first empirically documented deployment environment. The ruler works. Now we point it elsewhere.