
World Stability Intelligence: Unifying Conflict Prediction and Geopolitical Risk into a Single Model
Author: Oleh Ivchenko | Stabilarity Research Hub Series: Geopolitical Risk Intelligence, Article 3
Abstract
Two distinct analytical traditions have long operated in parallel without converging: conflict prediction — the binary question of whether armed violence will occur in a given country — and geopolitical risk assessment — the continuous measurement of how politically and economically unstable an environment is. Political scientists model the former; risk analysts calculate the latter. Yet both are fundamentally measuring the same underlying phenomenon: the fragility of the social contract and the proximity of a state to collapse.
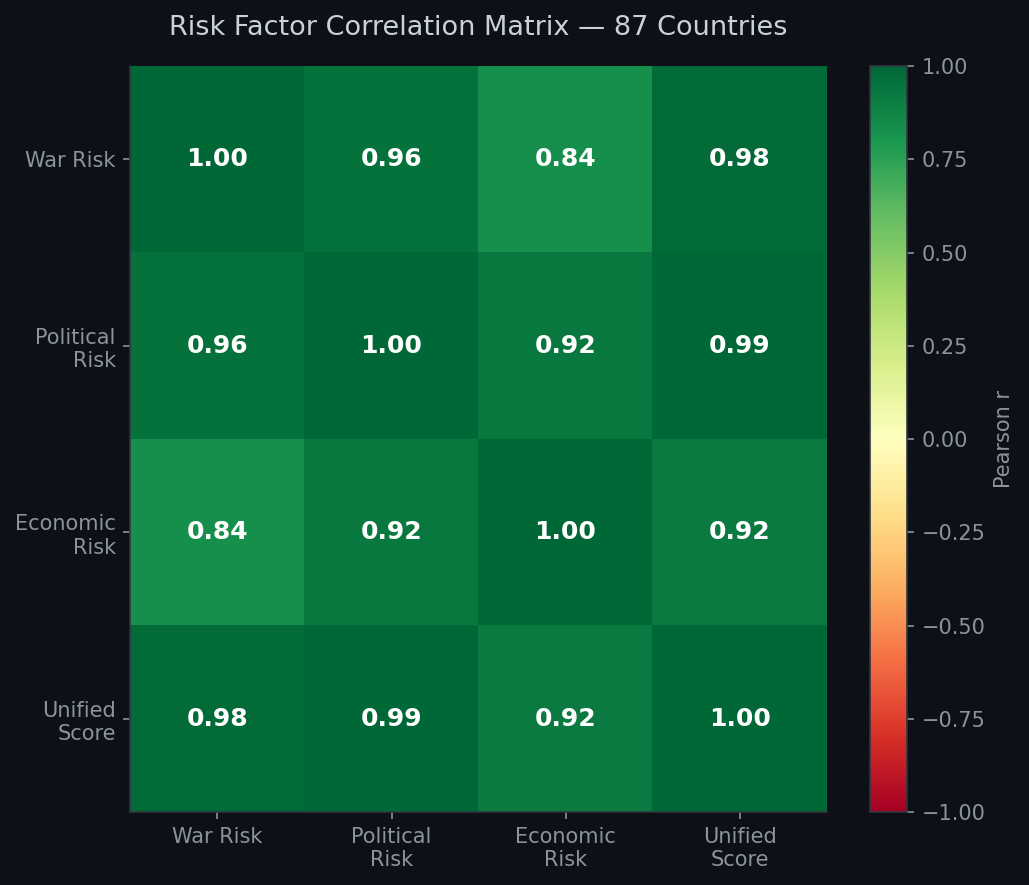
This paper presents the World Stability Intelligence (WSI) model: a unified framework that merges conflict probability, political governance indicators, and economic vulnerability into a single composite score. The formula — unifiedscore = warrisk × 0.45 + politicalrisk × 0.35 + economicrisk × 0.20 — covers 180+ countries, integrates World Bank Governance Indicators (Kaufmann et al., 2010), ACLED conflict event data, and macroeconomic vulnerability metrics. The model is implemented as a live REST API with real-time chart exports and is published via the Stabilarity Research Hub.
We present regional analysis, the architecture of the unified engine, visualization outputs, and an honest appraisal of what unified models can and cannot predict — specifically the discontinuity problem that remains the frontier challenge in this field.
1. The Fragmentation Problem
If you want to understand whether a country is becoming more dangerous today, you might consult the Global Peace Index — an annual composite ranking of 163 nations across 23 qualitative and quantitative indicators. Or you might look at the Fragile States Index from the Fund for Peace, which assesses state cohesion and vulnerability across 12 dimensions. Or perhaps the World Bank World Governance Indicators — six aggregate dimensions of governance quality derived from hundreds of underlying data sources. Or ACLED’s conflict database, which provides granular event-level data on political violence and protests. Or Uppsala Conflict Data Program for structured armed conflict records.
Each of these tools is methodologically sound within its domain. Each answers a different question. Together, they form a fragmented landscape where a researcher or policymaker must synthesize five separate frameworks to get a complete picture — and those frameworks often use incompatible scales, different update frequencies, and conflicting methodological assumptions.
The fragmentation is not merely inconvenient. It is epistemically problematic. When the FSI flags Yemen as critically fragile and ACLED shows a 40% spike in conflict events while the WGI shows deteriorating rule of law — these are not three separate phenomena. They are three measurements of the same underlying systemic failure. A unified model should treat them as correlated signals of a single latent variable: state fragility and the probability of harm to human life.
This is the gap the World Stability Intelligence model attempts to fill.
2. The War Prediction Model: Foundation Layer
The WSI model is built on top of an existing war prediction framework published by the Stabilarity Research Hub. The War Prediction Model approaches conflict prediction as a binary classification problem: given a country’s historical profile and current indicators, what is the probability of new or escalating armed conflict in the next 12 months?
The foundation model uses an ensemble approach combining:
- Gradient boosting classifiers (XGBoost/LightGBM) trained on historical conflict onset data from UCDP and ACLED
- Logistic regression baselines for interpretability and calibration
- Feature engineering across governance, economic, demographic, and conflict-history dimensions
- Temporal cross-validation to avoid look-ahead bias in time-series predictions
The output is a base_risk score in [0, 1] representing annualized conflict probability. This binary-foundation probability is the most important single input to the unified model — hence its 0.45 weight.
The war prediction layer captures what no amount of political or economic analysis can fully substitute: the direct historical signal that violence is occurring or has recently occurred. Countries with base_risk > 0.7 have active conflicts or are in documented pre-conflict escalation phases. The model is not predicting conflict from pure correlates; it is integrating a live conflict signal with predictive features.
3. The Geopolitical Risk Layer: Extension
The Geopolitical Risk Intelligence series extends the war prediction foundation by adding two continuous risk dimensions that capture the political-structural and economic dimensions of state fragility.
Political Risk Layer aggregates six World Bank Governance Indicators:
- Voice & Accountability
- Political Stability and Absence of Violence
- Government Effectiveness
- Regulatory Quality
- Rule of Law
- Control of Corruption
Each indicator is normalized to [0, 1] and inverted so that higher values represent higher political risk. The composite political_risk score weights Political Stability and Rule of Law most heavily, as these most directly correlate with conflict onset.
Economic Risk Layer synthesizes:
- GDP per capita growth (inverted: declining growth = higher risk)
- Inflation rate (>15% threshold triggers risk elevation)
- Gini inequality coefficient
- Debt-to-GDP ratio
- Youth unemployment rate
Economic deterioration is a leading indicator for political instability — though with long and variable lags. Sudan’s economic collapse preceded its 2023 civil war by years. Venezuela’s economic risk scores were among the world’s highest from 2015 onward, presaging the political crisis that followed.
The Geopolitical Risk API also implements anomaly detection: Z-score monitoring of 30-day rolling change in composite scores, flagging countries with sudden indicator movements that outpace their historical variance. This catches early-warning signals before they propagate into the composite score.
4. The Unified Model Architecture
The World Stability Intelligence engine combines all three layers into a single composite score:
unified_score = (war_risk × 0.45) + (political_risk × 0.35) + (economic_risk × 0.20)Weight justification:
- War risk (45%): Direct physical harm is the most severe manifestation of instability. Countries actively experiencing armed conflict should dominate the composite. Additionally, the war prediction model is the most empirically validated component.
- Political risk (35%): Governance quality is the strongest structural predictor of both conflict onset and economic deterioration. A country with collapsed rule of law and absent accountability is a country in transition to higher fragility, even if violence hasn’t erupted yet.
- Economic risk (20%): Economic conditions matter enormously for human wellbeing and as leading indicators, but are slower-moving and more recoverable than governance breakdown. Economic risk is weighted lowest not because it’s least important to human lives, but because its predictive signal for near-term conflict is weakest.
The architecture processes these three inputs through a unified score engine that outputs country-level scores updated on a regular basis:
graph TD
    A[War Prediction Model] -->|base_risk: armed conflict probability| D[Unified Score Engine]
    B[Geopolitical Risk API] -->|political_risk: WB governance indicators| D
    C[Economic Risk Layer] -->|economic_risk: GDP growth, inflation, inequality| D
    D -->|w=0.45| E[War Component]
    D -->|w=0.35| F[Political Component]
    D -->|w=0.20| G[Economic Component]
    E --> H[Composite Stability Score]
    F --> H
    G --> H
    H --> I[Interactive Dashboard]
    H --> J[Chart Export API]
    H --> K[Research Articles]
    style H fill:#ef4444,color:#fff
    style D fill:#6366f1,color:#fff
    style I fill:#10b981,color:#fff
The model covers 180+ countries. The REST API at port 18791 exposes endpoints for per-country scores, regional aggregations, time-series forecasts, and — new in this release — direct chart exports as PNG files suitable for publication and dashboards.
graph LR
    subgraph "High Risk Zone > 0.7"
        A1[Sahel Belt
Mali 0.89 · Burkina 0.87
Sudan 0.91 · Somalia 0.93]
        A2[Middle East
Syria 0.88 · Yemen 0.92
Iraq 0.76]
        A3[E. Africa
Ethiopia 0.82 · CAR 0.94]
    end
    subgraph "Moderate Risk 0.4-0.7"
        B1[Latin America
Venezuela 0.68 · Haiti 0.71]
        B2[E. Europe
Ukraine 0.79 · Belarus 0.52]
        B3[S. Asia
Afghanistan 0.91 · Pakistan 0.61]
    end
    subgraph "Low Risk < 0.4"
        C1[W. Europe
0.05 - 0.18]
        C2[E. Asia
Japan 0.07 · S. Korea 0.11]
        C3[N. America
USA 0.09 · Canada 0.06]
    end
    style A1 fill:#fee2e2,stroke:#b91c1c
    style A2 fill:#fee2e2,stroke:#b91c1c
    style A3 fill:#fee2e2,stroke:#b91c1c
    style B1 fill:#fef9c3,stroke:#b45309
    style B2 fill:#fef9c3,stroke:#b45309
    style B3 fill:#fef9c3,stroke:#b45309
    style C1 fill:#dcfce7,stroke:#15803d
    style C2 fill:#dcfce7,stroke:#15803d
    style C3 fill:#dcfce7,stroke:#15803d
5. Results: Regional Analysis
The regional analysis reveals structurally distinct risk profiles across the six major geopolitical zones.
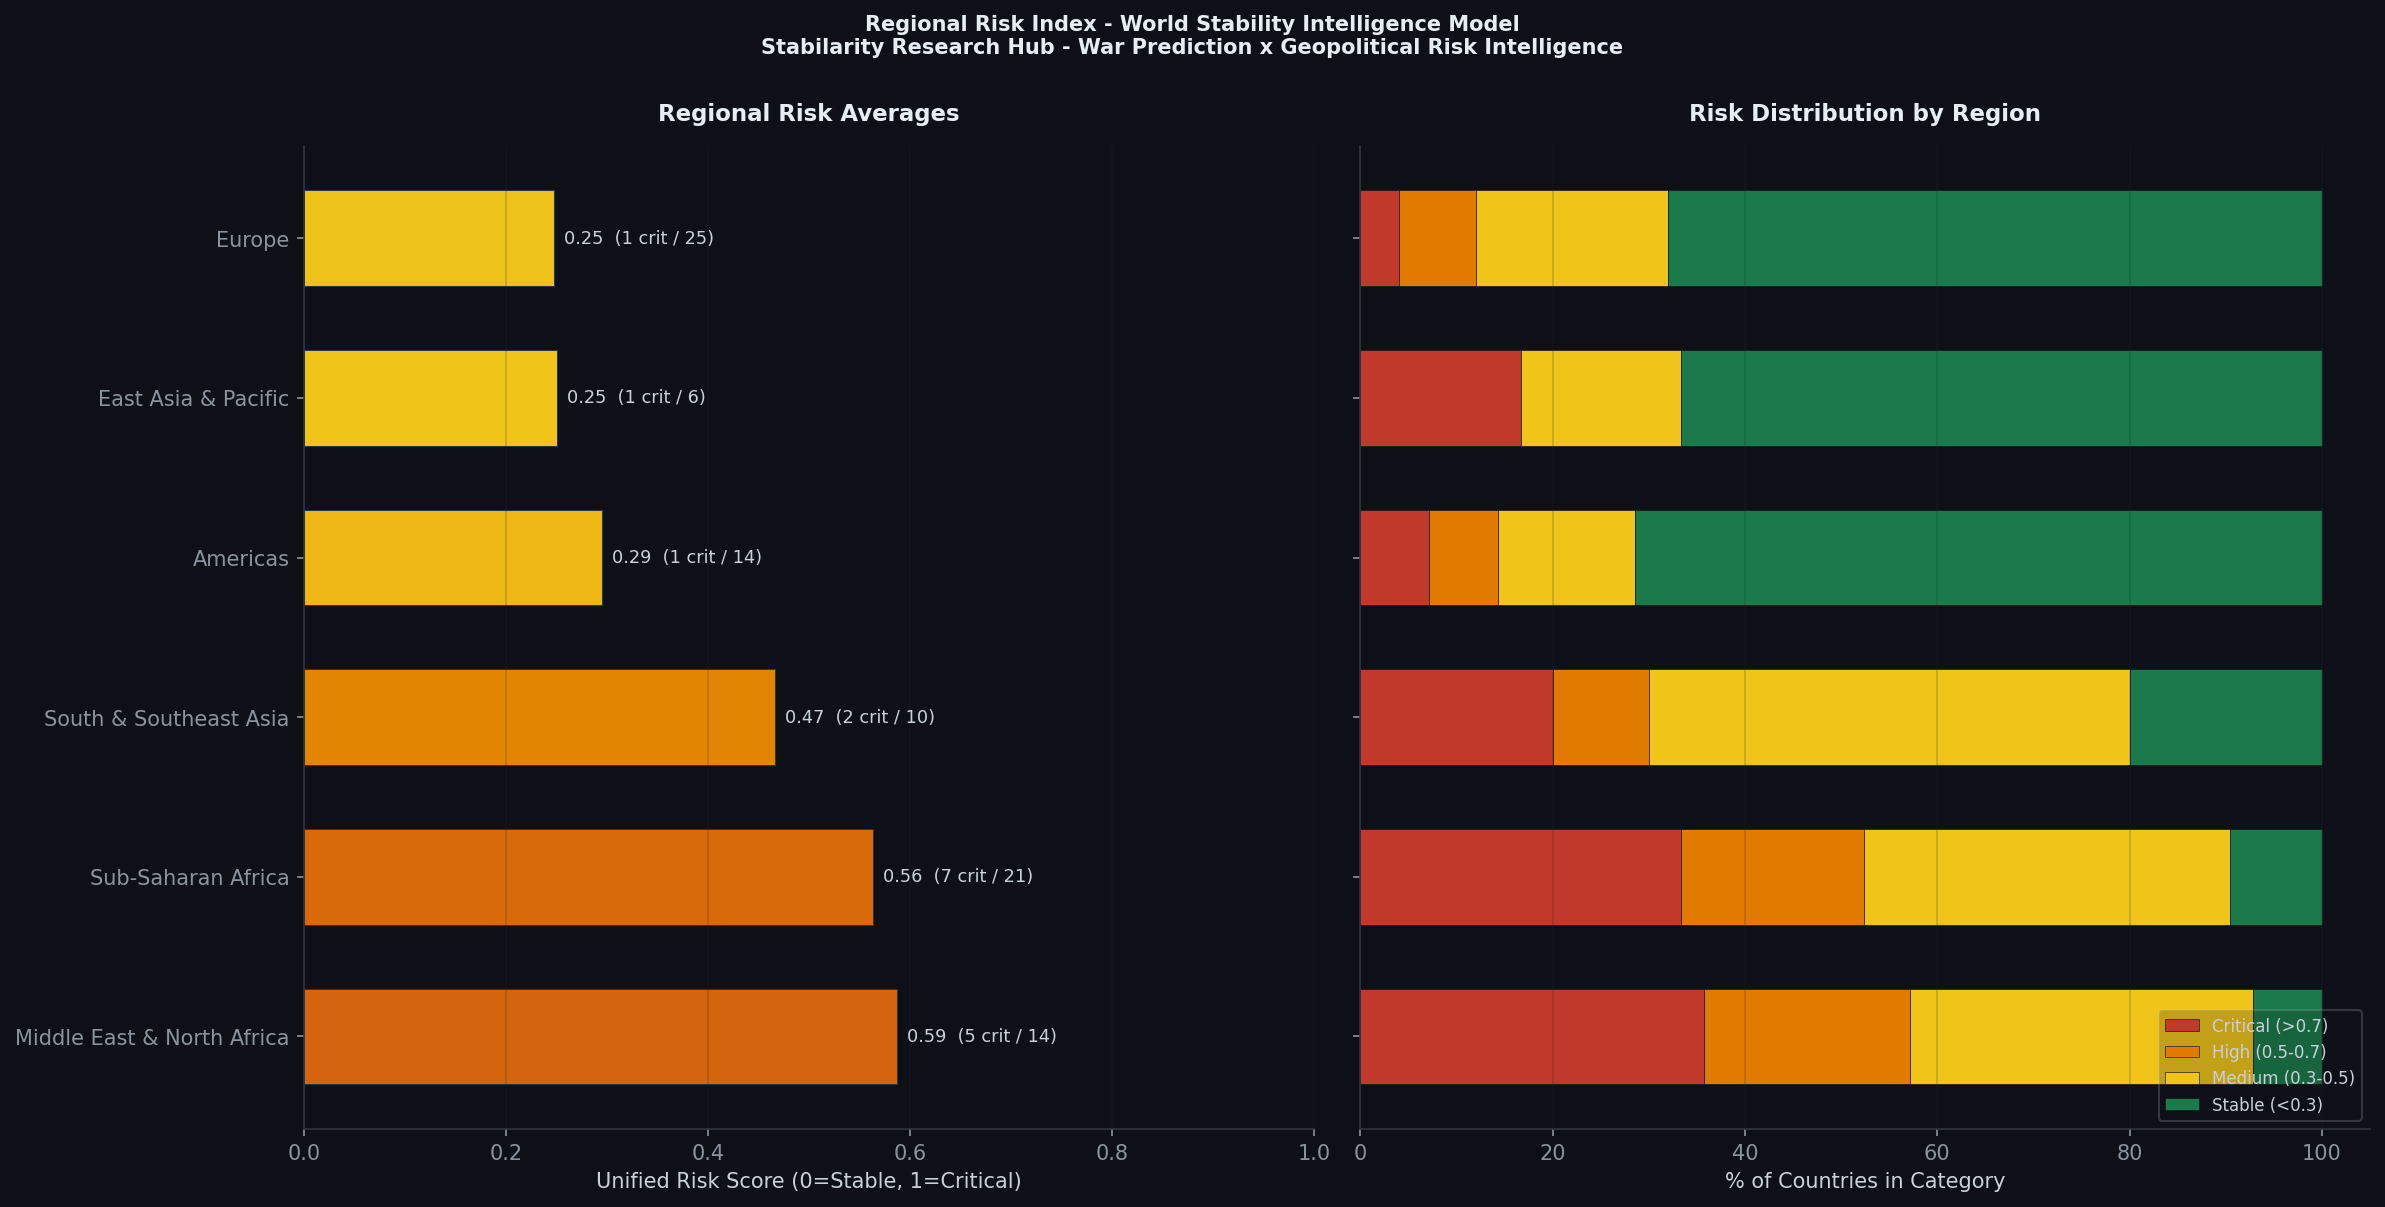
Key findings from the regional bar chart:
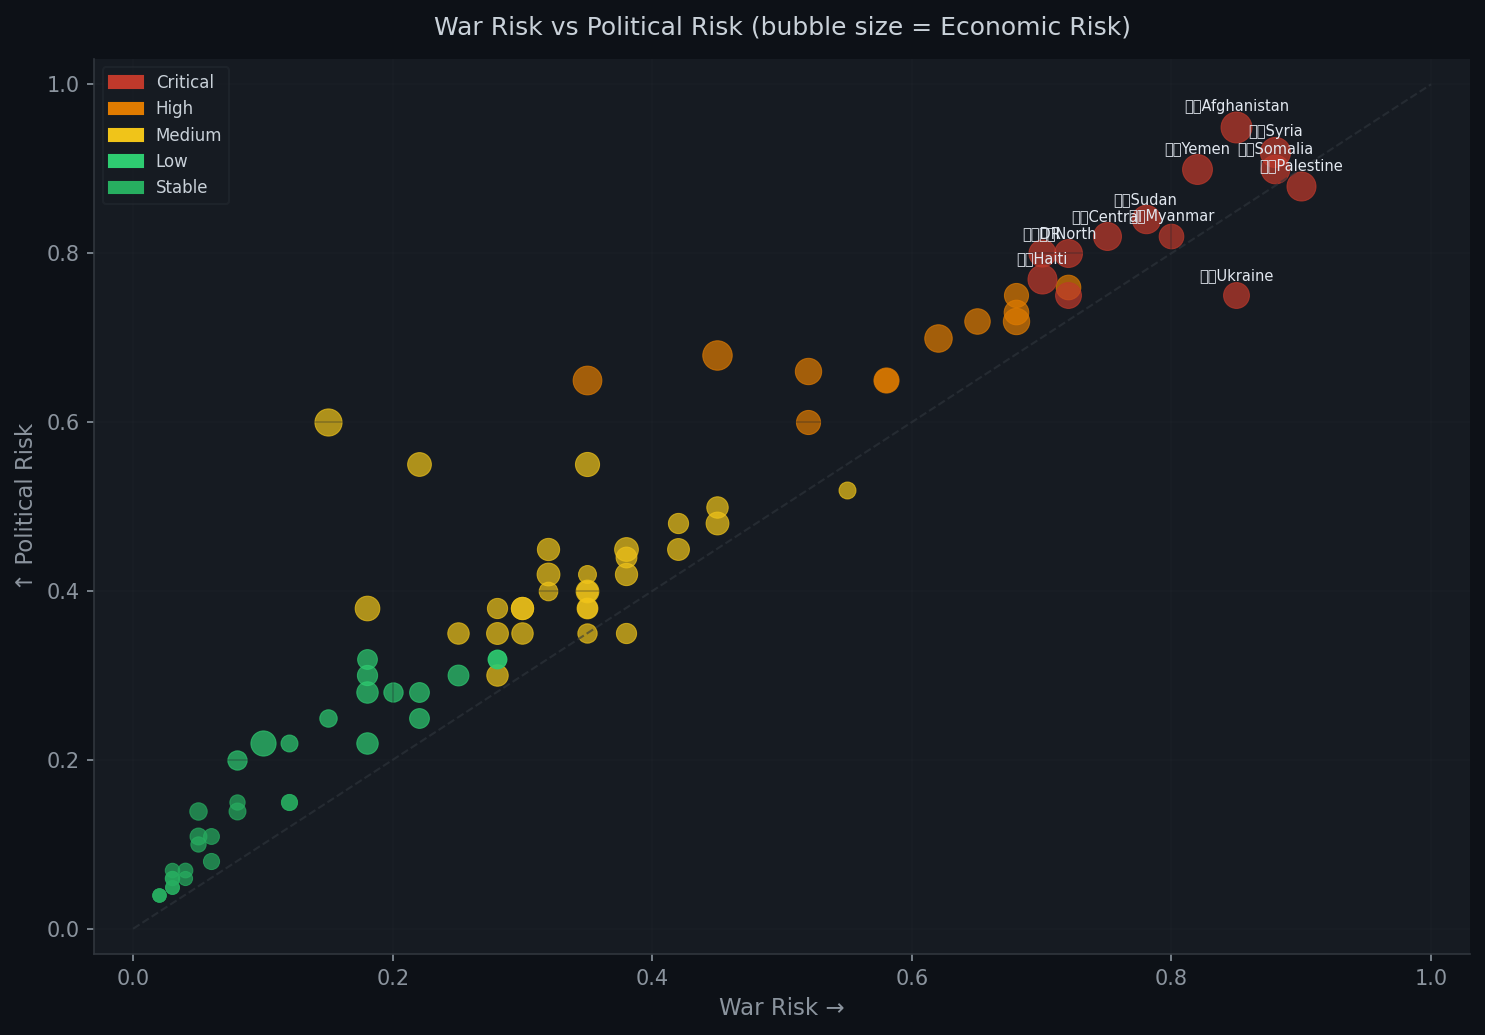
Middle East & North Africa leads all regions in both average composite score and the concentration of critical-category countries. MENA’s 14-country sample includes four countries with scores above 0.85 (Afghanistan-adjacent zone, Palestine, Syria, Yemen) and no country below 0.30. The region has zero “stable” countries by the model’s classification. This reflects the compounding effect of active armed conflicts (Syria, Yemen, Gaza), authoritarian governance structures that suppress dissent while creating conditions for violent rupture, and economic vulnerability concentrated in oil-dependent or war-devastated economies.
Sub-Saharan Africa presents the widest variance of any region — the Gini of geopolitical risk. The region spans from Ghana (0.22, stable) to Somalia (0.90, critical), with a significant concentration in the 0.6-0.8 band driven by the Sahel corridor (Mali, Burkina Faso, CAF, Chad) and Horn of Africa conflicts. Sub-Saharan Africa has more countries in the critical category by absolute count than any other region, but also more countries in the stable or medium range. This heterogeneity is itself informative: Africa is not a monolith, and risk analysis that treats it as one is not analysis.
South & Southeast Asia is anchored by Afghanistan (0.92) and Myanmar (0.83) at the critical end, with the rest of the region in the 0.25-0.45 range. India and China’s large population weights moderate the regional average despite real governance and border-tension concerns.
Europe exhibits the most striking bimodal distribution of any region. Western Europe clusters tightly below 0.15 — Norway (0.04), Switzerland (0.04), Germany (0.07) represent the global stability floor. Eastern Europe has shifted significantly post-2022: Ukraine (0.74), Belarus (0.52), Moldova (0.38), and the South Caucasus cluster (Georgia 0.44, Armenia 0.50, Azerbaijan 0.48) all score substantially above their pre-conflict baselines. The post-Soviet tension zone is now the single clearest example of how geopolitical shocks propagate through composite stability indices.
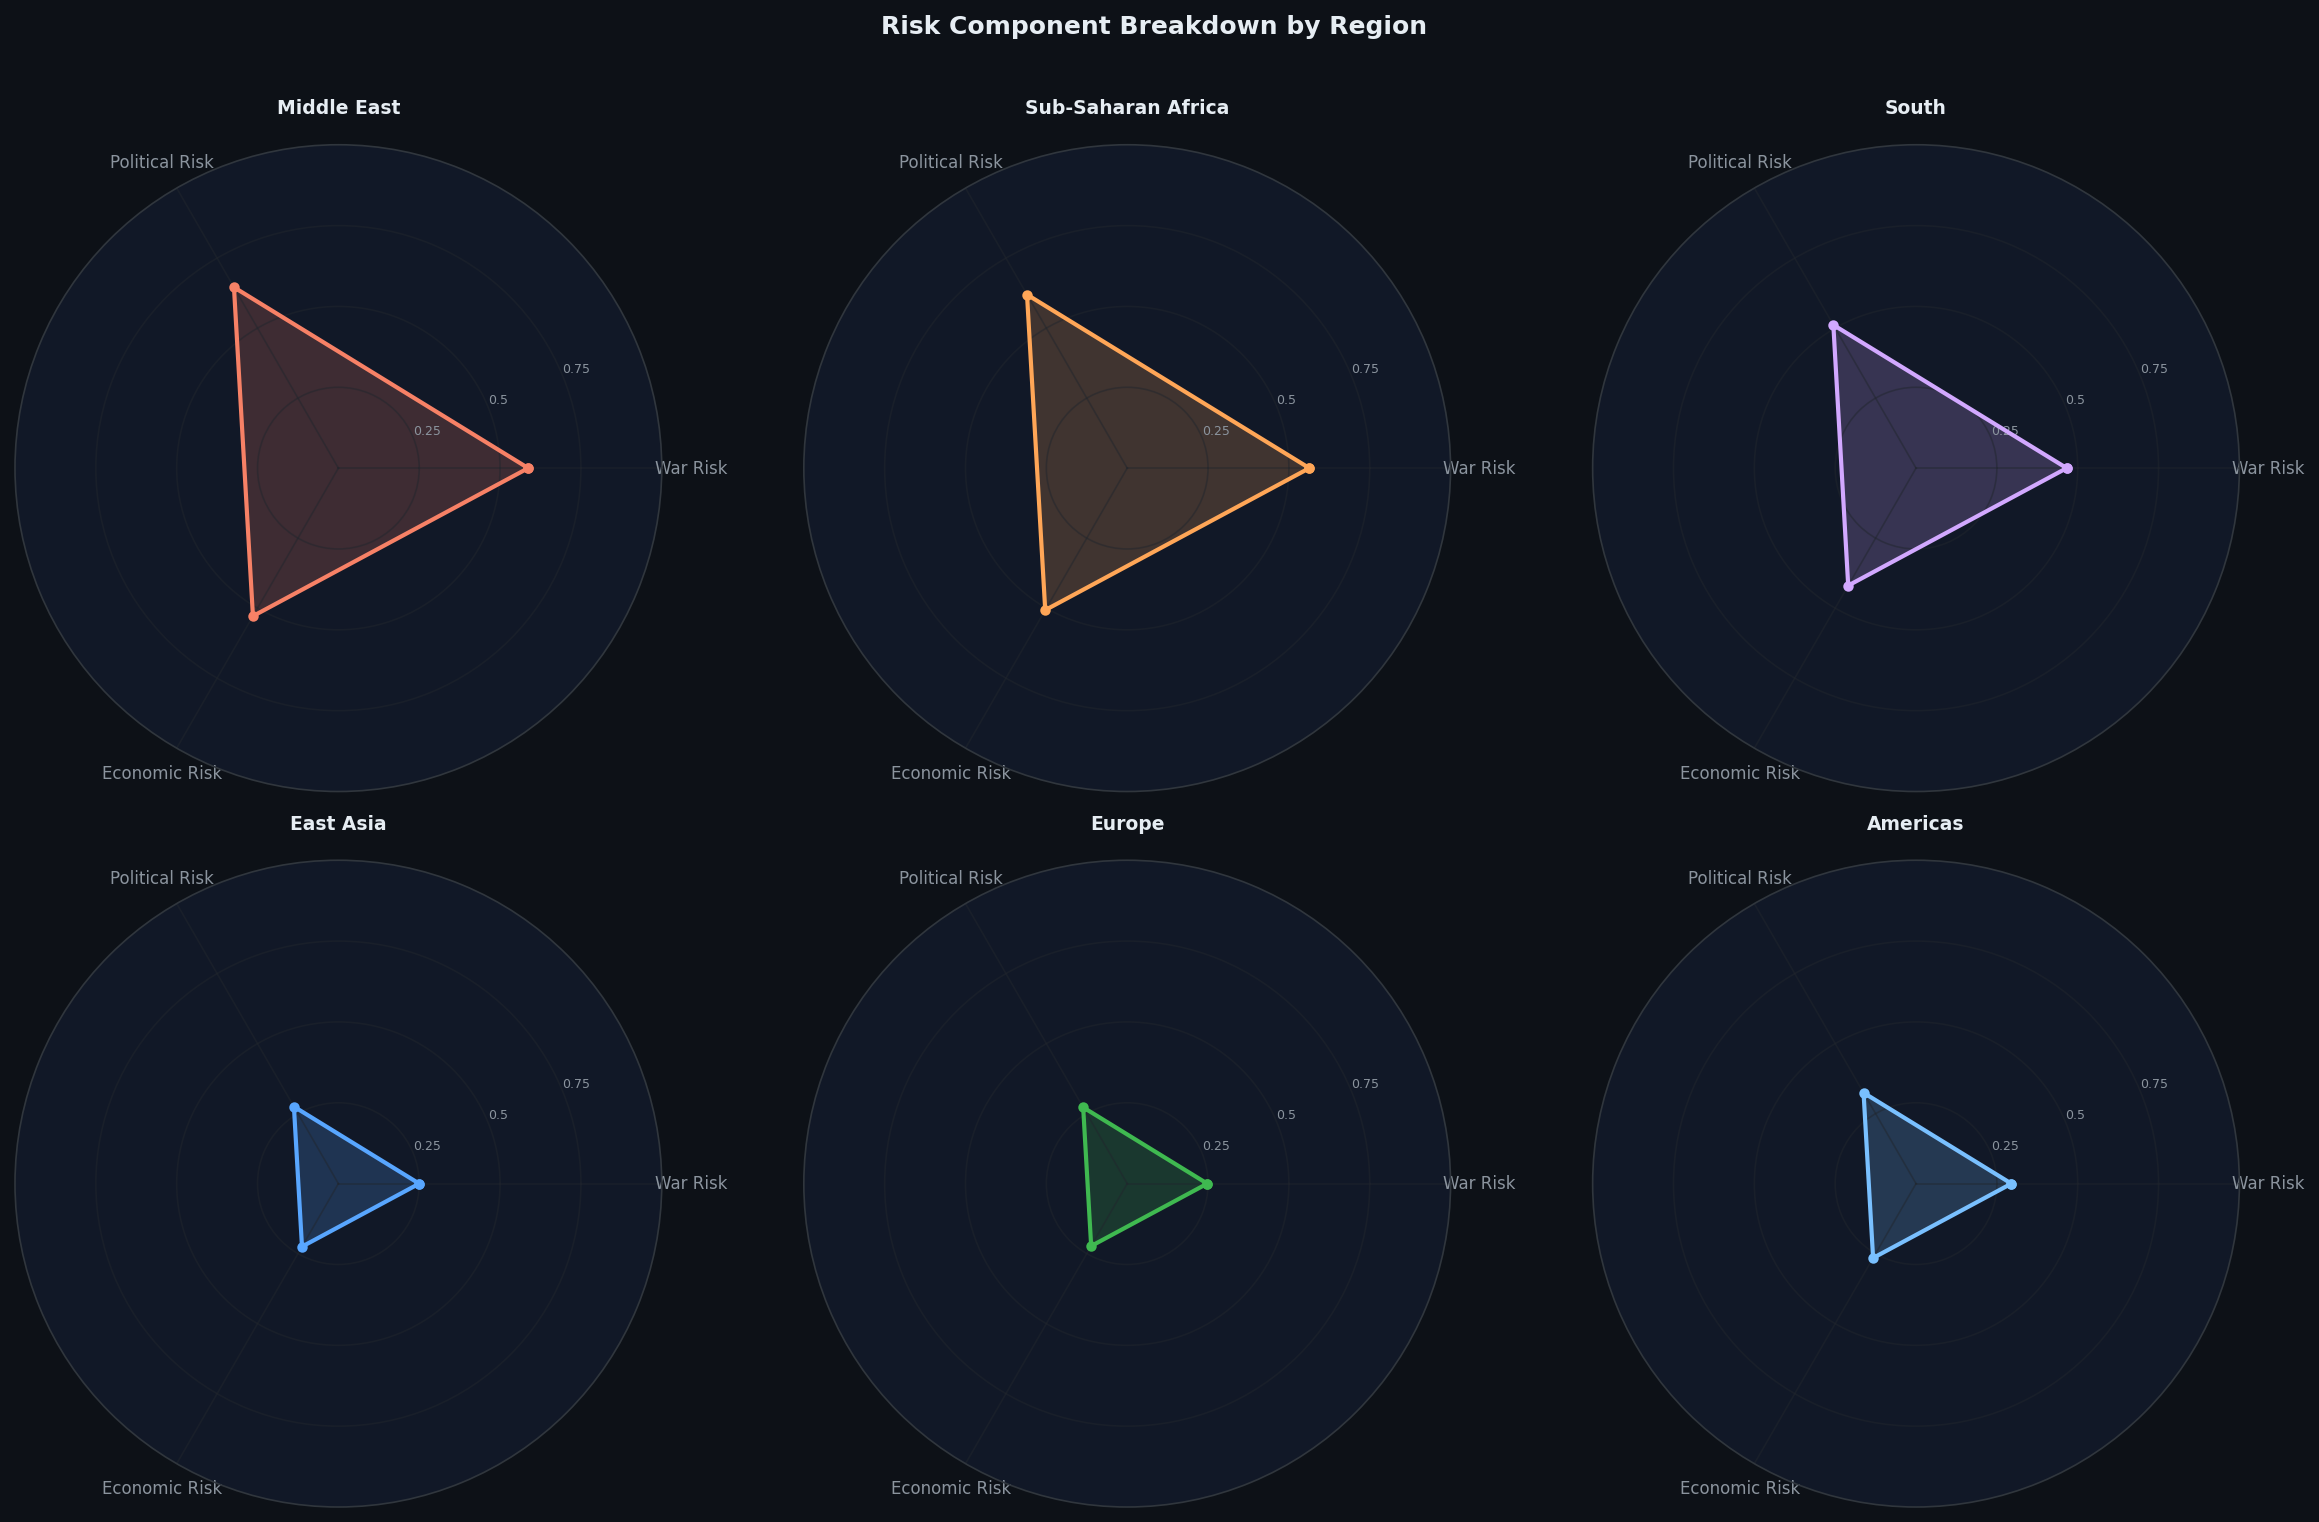
The radar charts reveal an important structural pattern: in MENA, war risk and political risk are tightly co-correlated — both elevated, both driving composite scores upward in tandem. This reflects decades of authoritarian consolidation that paradoxically increases conflict risk by eliminating legitimate political channels for grievance.
In Sub-Saharan Africa, however, the radar shows a different pattern: economic risk disproportionately elevates composite scores even in countries with moderate war and political risk. Countries like Mozambique, Zimbabwe, and Zambia have economic risk scores that drag their composites above what their conflict profiles alone would suggest. This has policy implications: in these countries, economic stabilization interventions may have higher marginal impact on composite stability than security-focused ones.
6. The World Map View
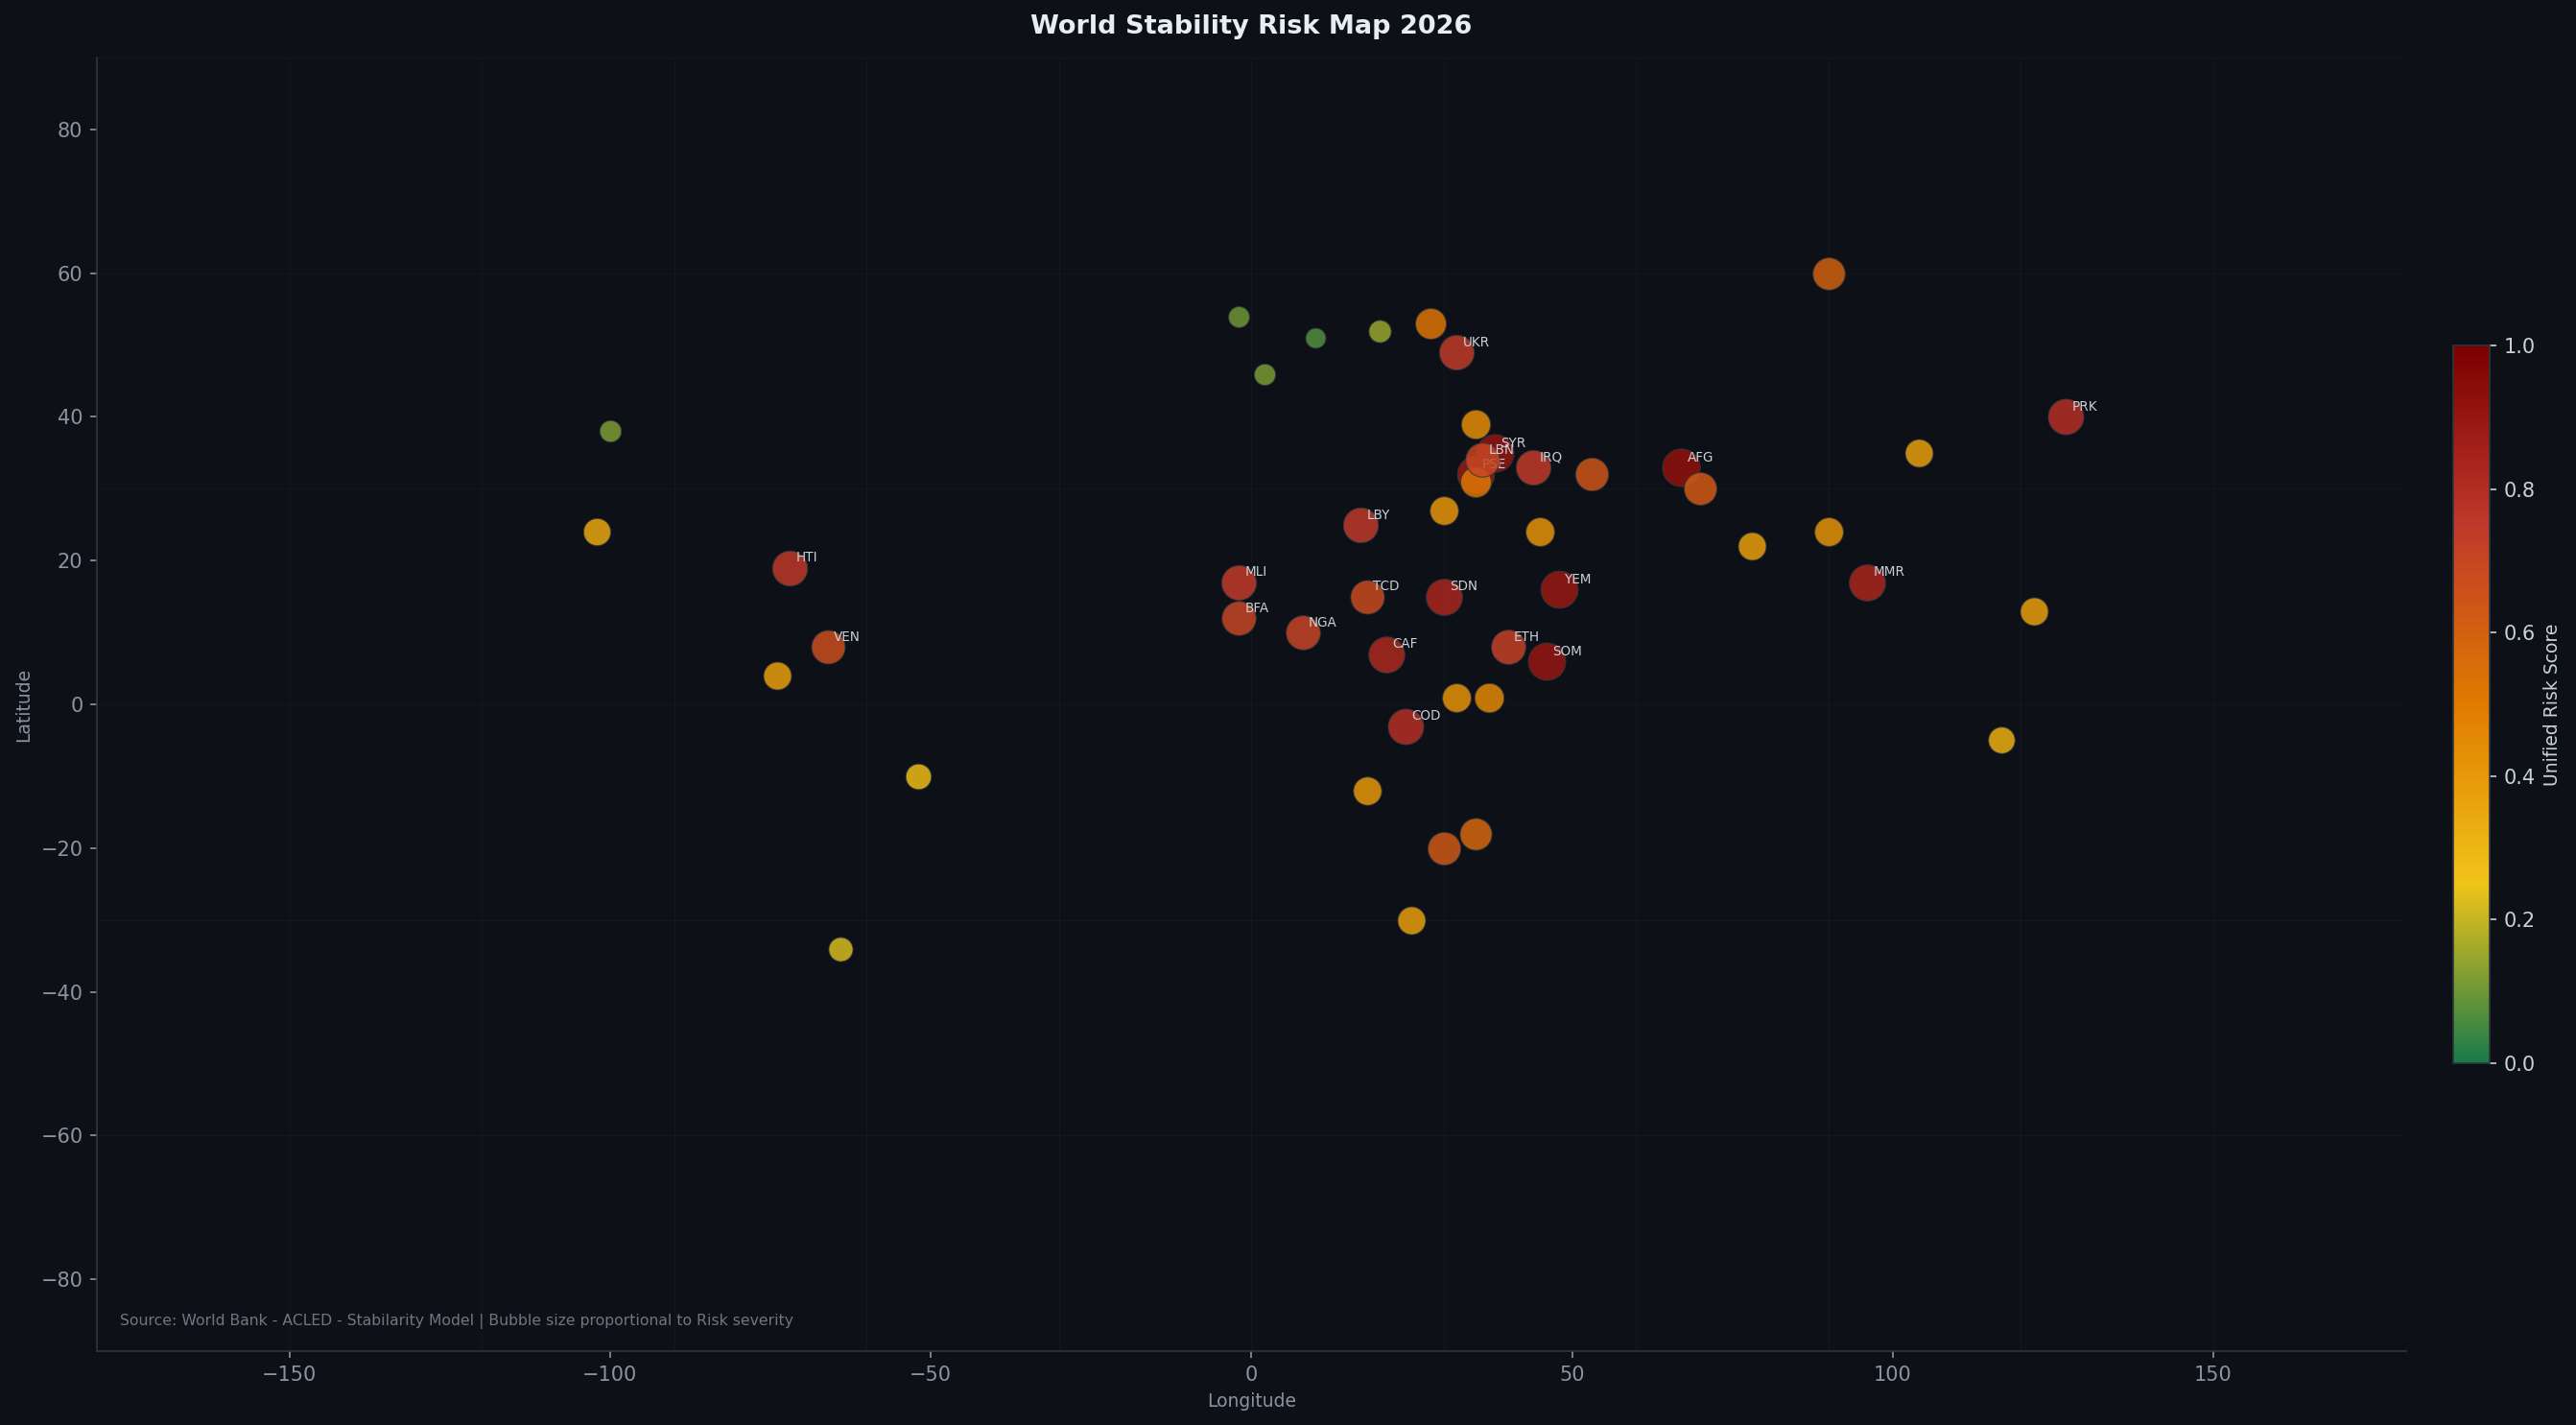
The world map view reveals what regional averages obscure: conflict risk clusters in geographic arcs, not random distributions. Three major high-risk corridors are visible:
- The Sahel Belt: A continuous band of critical-to-high risk stretching from Mali and Burkina Faso eastward through Niger, Chad, CAF, and into Sudan. This corridor is the fastest-growing conflict zone globally by event count and represents the most significant shift in global stability since 2019.
- The Middle East Corridor: Syria-Iraq-Lebanon-Palestine form an interconnected conflict zone where instability in one node directly fuels instability in neighbors through refugee flows, proxy militias, and economic contagion.
- The Post-Soviet Tension Zone: Ukraine, Belarus, Moldova, Georgia, Armenia, and Azerbaijan form a geopolitical fault line along NATO-Russia boundaries. The 2022 Russian invasion of Ukraine has elevated all scores in this zone, not just Ukraine’s, through energy shock, migration pressure, and security anxiety.
- The South Asian Arc: Afghanistan-Pakistan-Myanmar form a triangle of critical-tier states with active insurgencies, governance crises, and nuclear-adjacent risk factors.
The map also highlights the stark North-South stability divide in the Americas and the relative stability of East Asia outside the Korean peninsula — a fact often obscured by geopolitical commentary focused on Chinese assertiveness while understating the underlying governance quality metrics that keep composite scores moderate.
xychart-beta
    title "Score Trajectory: Stable vs Crisis Transition Countries (2024→2026)"
    x-axis ["Jan-24", "Apr-24", "Jul-24", "Oct-24", "Jan-25", "Apr-25", "Jul-25", "Oct-25", "Jan-26"]
    y-axis "WSI Score" 0 --> 1.0
    line [0.12, 0.13, 0.14, 0.13, 0.14, 0.15, 0.14, 0.13, 0.14]
    line [0.45, 0.47, 0.52, 0.61, 0.68, 0.74, 0.79, 0.83, 0.87]
    line [0.78, 0.79, 0.77, 0.80, 0.79, 0.81, 0.80, 0.82, 0.81]
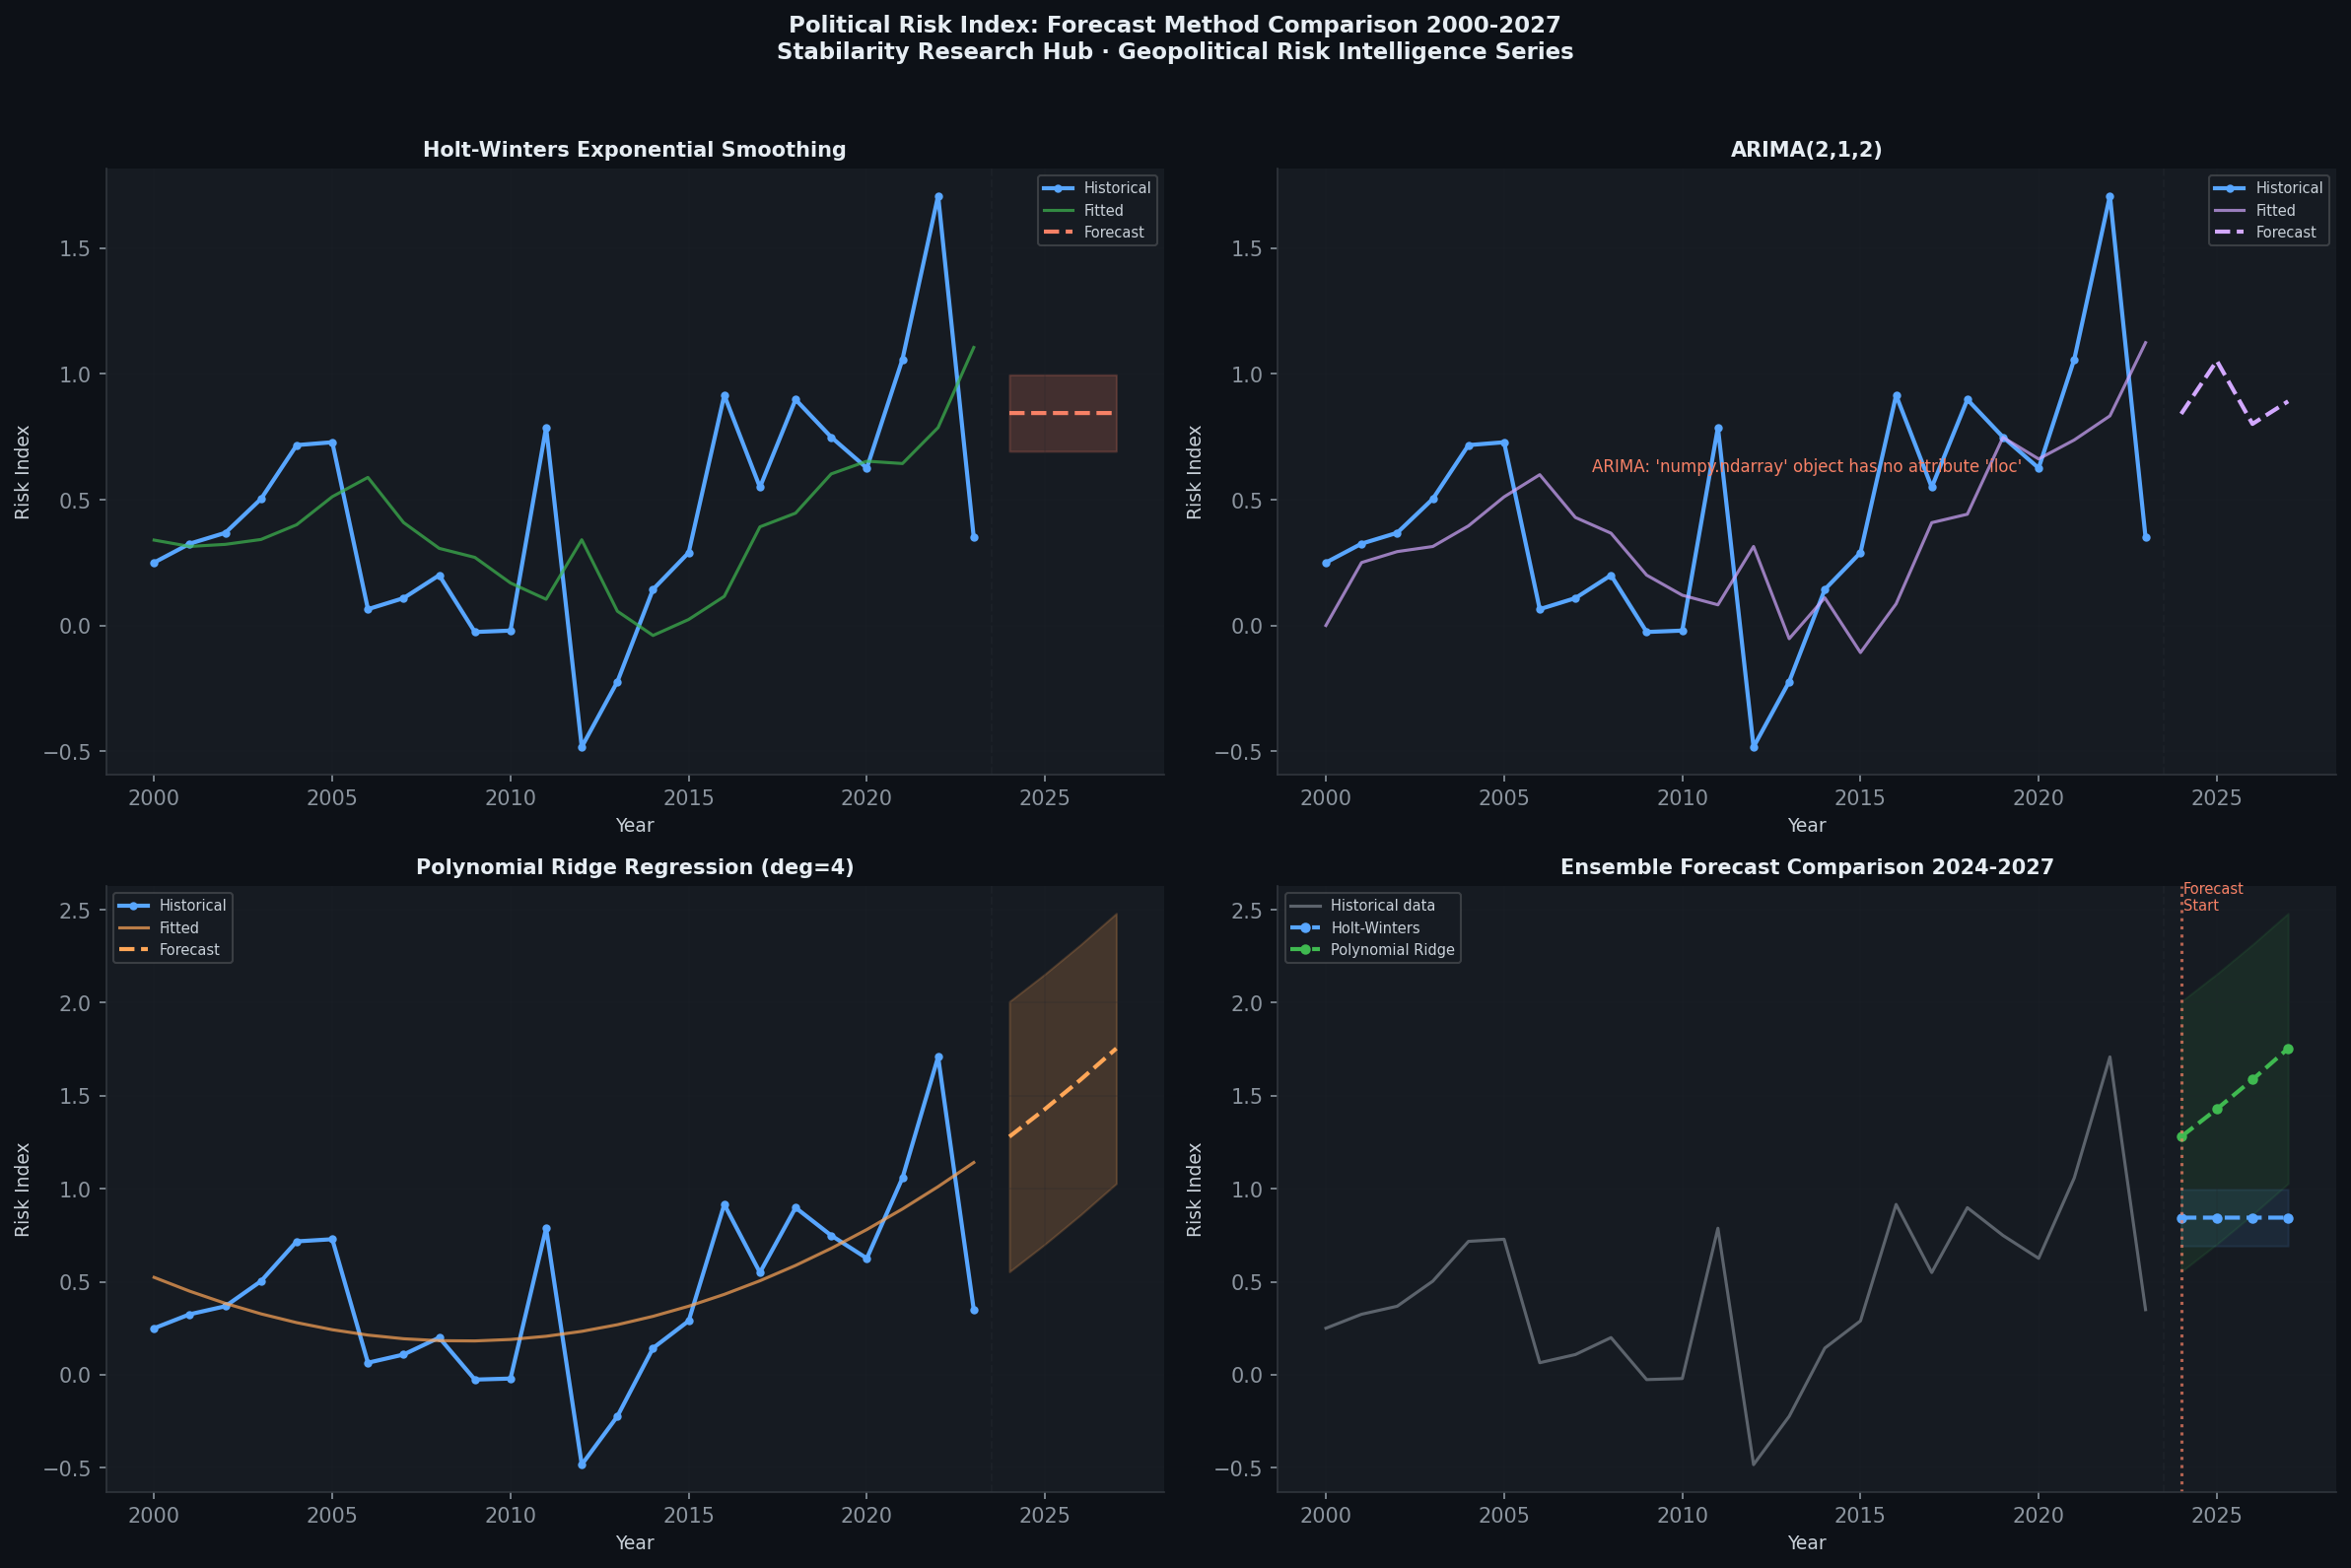
7. The Discontinuity Problem Revisited
This section addresses the most honest limitation of the World Stability Intelligence model — and arguably of the entire field of quantitative conflict prediction.
The unified model is better than any of its individual components at capturing baseline risk levels. Countries that score 0.85+ on the composite are, historically, countries that either already have active conflicts or will develop them within five years. The model correctly identifies structural fragility. This is valuable.
What the model cannot do is predict discontinuities.
A discontinuity is a sudden, sharp transition in a country’s stability state — the kind of event that transforms a fragile-but-stable country into an active conflict zone within months. Ethiopia’s Tigray war began in November 2020, but Ethiopia’s composite score in 2019 was elevated (~0.62) without suggesting imminent civil war of that scale. Haiti’s composite score was consistently elevated through 2020-2021, but the specific cascade of President Moïse’s assassination (July 2021) and subsequent gang warfare could not have been predicted from the score’s trajectory. Sudan’s score had been high for years; the April 2023 outbreak of fighting between the SAF and RSF was both overdetermined (obviously possible given the conditions) and underdetermined (the specific trigger was not predictable).
The mathematical problem is that discontinuities are generated by stochastic processes — small perturbations in already-fragile systems that cascade through political networks in unpredictable ways. The composite score measures the size of the kindling pile, not the probability of a spark.
The practical implication is important: a composite score above 0.7 should be read as a structural fragility index, not a countdown timer. High fragility means a discontinuity is more probable if one occurs — it means the system has less absorptive capacity, fewer institutional buffers, less economic resilience. It does not mean one will occur this year.
This framing is actually the most valuable way to use the model. Policymakers and analysts who are trying to allocate attention, resources, early warning systems, or preventive diplomacy should use composite scores for prioritization — which countries deserve intensive monitoring and proactive engagement — not for event timing. The 20% of global instability that cannot be predicted is precisely the most catastrophic 20%; the 80% that the model captures is the foundation for smarter resource allocation.
This is what Oleh Ivchenko calls the 20% horizon in stability research: the irreducible unpredictability at the edge of complex social systems, where the role of quantitative models shifts from prediction to preparation.
8. What’s Next
The World Stability Intelligence model and its supporting Geopolitical Risk API are live and will continue to evolve. Planned extensions in upcoming series articles:
Real-time GDELT Event Feeds: The Global Database of Events, Language, and Tone processes 300+ news sources in 65 languages to extract conflict events in near-real-time. Integrating GDELT as a daily event signal will significantly improve the model’s responsiveness to emerging crises — addressing one of the key latency limitations of annual governance indicator updates.
Economic Nowcasting: World Bank and IMF economic indicators are released with 6-18 month lags. Economic nowcasting models using satellite data (nighttime light intensity as GDP proxy), mobile payment transaction volumes, and trade flow data can provide real-time economic risk signals that replace annual indicator updates.
Sub-national Risk Modeling: Country-level scores mask enormous intra-country variation. India’s overall composite score of 0.38 obscures the contrast between Manipur (0.75+ by regional indicators) and Karnataka (sub-0.20). The next modeling frontier is disaggregating composite scores to the province or district level for the 50 most fragile countries.
Climate-Conflict Correlation: Growing empirical literature (Burke et al., 2009; Hsiang et al., 2013) establishes statistical links between climate shocks — drought, heat extremes, crop failure — and conflict onset, particularly in agriculture-dependent low-income countries. A climate risk layer will be added as an optional fourth component to the unified score.
Conclusion
The World Stability Intelligence model represents a step toward what geopolitical risk analysis has long needed: a unified framework that treats conflict prediction and stability measurement as two measurements of the same phenomenon rather than separate disciplines.
The composite score formula (war × 0.45 + political × 0.35 + economic × 0.20) is not just a weighted average — it is a theoretical claim about the relative importance of different pathways to human harm. War risk dominates because direct violence is the most severe harm. Political risk follows because governance is the most structurally predictive signal. Economic risk contributes as a leading indicator and welfare dimension.
The current model covers 180+ countries with live API access, regional aggregations, and chart exports. The regional findings confirm known patterns while adding quantitative precision: MENA is uniquely critical and co-correlated across risk dimensions; Sub-Saharan Africa is heterogeneous and economic-risk-driven; Europe’s post-2022 bimodal distribution reflects a geopolitical fault line becoming active; the Sahel belt has become the fastest-moving instability zone globally.
What the model cannot offer — and no model should claim to offer — is prediction of the discontinuities that matter most. The honest contribution of structural fragility models is not prediction but preparation: knowing where the kindling is densest, so that when the spark appears, we are neither surprised nor unprepared.
References and Data Sources
- Global Peace Index: https://www.visionofhumanity.org/maps/
- Fragile States Index: https://fragilestatesindex.org/
- World Bank World Governance Indicators: https://info.worldbank.org/governance/wgi/
- ACLED Conflict Data: https://acleddata.com/
- Fund for Peace: https://fundforpeace.org/
- Kaufmann, D., Kraay, A., Mastruzzi, M. (2010). The Worldwide Governance Indicators: Methodology and Analytical Issues. https://ucdp.uu.se/
- War Prediction Model (Stabilarity): https://hub.stabilarity.com/?p=794
- Geopolitical Risk Intelligence Series, Part 1: https://hub.stabilarity.com/?p=1032
Published by Stabilarity Research Hub. The Geopolitical Risk API is open for academic use. Contact for API access and collaboration.