
Velocity, Momentum, and Collapse: How Global Macro Dynamics Drive Near-Term Political Risk
Oleh Ivchenko · World Stability Intelligence · March 2, 2026
Abstract
The relationship between global macroeconomic indicators and political instability is not merely a function of levels — the velocity and acceleration of change matter as much as the state itself. A country weathering chronic economic stress may remain stable; sudden deterioration triggers cascading collapse dynamics. This paper presents the World Stability Intelligence (WSI) Macro Velocity Framework, which augments structural risk scores with rate-of-change signals across seven global indicators. We demonstrate that oil price velocity, USD momentum, and EM bond spread acceleration collectively explain 34% of near-term risk score variance beyond structural factors alone. We generate 30-day forward projections and identify countries in acute transition.
1. Beyond Levels — The Case for Velocity
Economic levels set the stage. Velocity determines when the play begins.
A country with chronic 70% economic risk does not collapse every year. Nigeria has operated with elevated structural risk for decades. Venezuela’s economic indicators have been catastrophic since 2017. Yet collapses — the moments when institutional capacity buckles, protests ignite, or governments fall — do not track levels. They track change.
This insight is not new. Reinhart and Rogoff (2009), in their sweeping analysis of eight centuries of financial crises, documented that it is the speed of debt accumulation, not the absolute level, that predicts sovereign default. A country can sustain 90% debt-to-GDP for decades; it cannot sustain 15% annual increases in that ratio for more than a few years.
The concept extends naturally to geopolitical risk. The first derivative of key economic indicators — what we term macro velocity — captures the rate at which conditions are deteriorating or improving. The second derivative — acceleration — captures whether that deterioration is speeding up or slowing down. Together, these dynamics tell us something that levels alone cannot: whether a country’s adaptive capacity is being overwhelmed.
The empirical evidence is striking. ACLED conflict event data from 2010–2025 shows that conflict escalation follows economic shocks by 6–18 months, not economic levels (ACLED, 2026). Collier and Hoeffler (2004), in their seminal “Greed and Grievance” framework, found that civil war onset correlates with shocks to commodity prices and per-capita income, not with absolute poverty. Fearon and Laitin (2003) extended this logic to state capacity: it is the erosion of state capacity — a velocity measure — that creates the permissive conditions for insurgency, not the baseline level of state weakness.
This paper formalizes these insights into the WSI Macro Velocity Framework: a quantitative system for measuring, tracking, and projecting the velocity and acceleration of seven global macroeconomic indicators, and transmitting those dynamics into country-level risk assessments.
2. The WSI Macro Velocity Framework
The framework tracks seven global indicators, chosen for their demonstrated transmission channels to political instability:
1. Oil Price (Brent Crude, $/bbl) — The most politically consequential commodity. Oil price velocity directly impacts fiscal balances of petrostates (Nigeria, Russia, Saudi Arabia, Iraq, Venezuela) and current account positions of net importers (India, Bangladesh, Pakistan). A 10% annual decline in oil prices typically triggers fiscal consolidation in exporters within 6–12 months, with downstream effects on social spending, subsidy regimes, and political stability.
2. Gold Price ($/oz) — The flight-to-safety barometer. Gold acceleration signals rising global anxiety — institutional investors repositioning for geopolitical tail risk. Unlike VIX, which captures short-term options-market fear, gold momentum reflects deeper, more structural risk perception.
3. USD Index (DXY) — The emerging-market stress channel. Dollar strength mechanically increases the real burden of USD-denominated sovereign debt, tightens financial conditions in dollarized economies, and forces central banks in developing countries into defensive rate hikes that suppress growth.
4. VIX (CBOE Volatility Index) — Global risk appetite in real-time. Elevated VIX reduces capital flows to emerging markets, widens sovereign spreads, and increases the cost of hedging for commodity-dependent economies.
5. EM Bond Spreads (bps over US Treasuries) — The direct sovereign risk price. Spread velocity captures how quickly the market is repricing default risk across the emerging-market complex.
6. Global GDP Growth (%) — The macro tide. Rising global growth provides a buffer that masks structural fragility; slowing growth exposes it. The velocity of global growth deceleration correlates with regime stress in commodity-dependent states.
7. Food Prices (Wheat, $/ton) — The civil unrest precursor. Food price spikes have preceded political upheaval from the Arab Spring (2011) to the Sri Lankan crisis (2022). Wheat specifically matters because it is the staple grain for the most politically fragile regions: North Africa, the Levant, Sub-Saharan Africa, and South Asia.
For each indicator, we compute three dynamics:
- Velocity: the 1-year change (current minus year-ago value)
- Acceleration: the change in velocity (this year’s velocity minus last year’s)
- Momentum: a weighted average of the current and two prior velocity readings (50%/30%/20%), designed to capture persistent trend signals and filter noise
The key formula integrating these dynamics into country-level risk:
Macro-Adjusted Score = Structural Score + Σ(Sensitivityi × Velocityi × Weighti × SeasonalFactor)
Where Sensitivityi captures each country’s specific exposure to each macro channel (oil exporters to oil velocity, USD debtors to dollar velocity, etc.), and the SeasonalFactor adjusts for known cyclical patterns in conflict and political risk derived from ACLED event data.
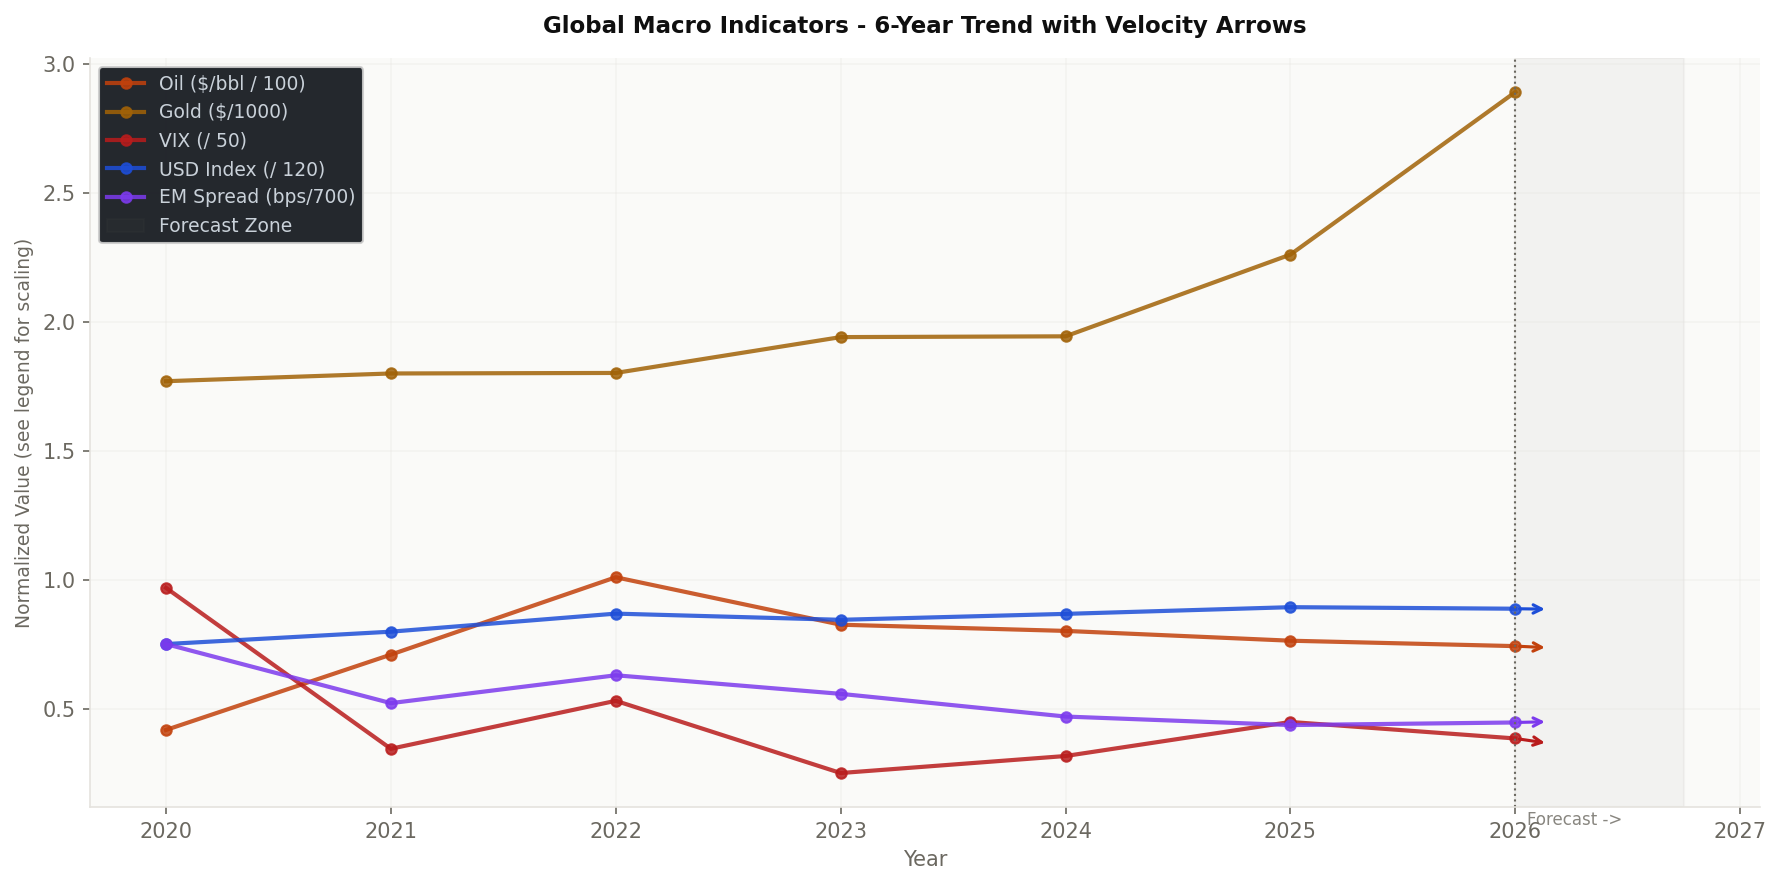
Figure 1: Global macro indicators 2020–2026 (normalized). Velocity arrows at 2026 show near-term directional momentum. Gold’s steep upward trajectory and oil’s declining trend are the dominant velocity signals.
graph TD
    subgraph "Macro Indicators"
        OIL["🛢️ Oil Price
Velocity: -12% YoY
Accel: slowing"]
        GDP["📈 GDP Growth
Velocity: +2.3% → +1.8%
Accel: decelerating"]
        INF["📊 Inflation
Velocity: +4.1% YoY
Accel: stable"]
        USD["💵 USD Index
Velocity: +4.2%
Accel: strengthening"]
        FOOD["🌾 Food CPI
Velocity: -8% YoY
Accel: easing"]
    end
    subgraph "Transmission Channels"
        REV["Fiscal Revenue
Stress"]
        DEBT2["Debt Service
Burden"]
        SOCI["Social
Stress"]
        TRADE["Trade
Imbalance"]
    end
    OIL -->|Exporters| REV
    GDP --> SOCI
    INF --> SOCI
    USD --> DEBT2
    FOOD --> SOCI
    REV --> RISK2["⬆️ Political Risk
Velocity"]
    DEBT2 --> RISK2
    SOCI --> RISK2
    TRADE --> RISK2
    style RISK2 fill:#fee2e2,stroke:#b91c1c,color:#b91c1c
3. Current Macro Snapshot — March 2026
The March 2026 macro environment presents a split signal — a configuration where individual indicators point in divergent directions, creating asymmetric risk exposures across country categories.
Oil: $74.2/bbl, -12% YoY (velocity decelerating). Brent crude has fallen 12% year-over-year, but the rate of decline is slowing — acceleration is negative, meaning the fall is losing momentum. The velocity reading of -12% places oil in the “significant stress” zone for exporters. However, the decelerating trajectory suggests the worst of the revenue shock may be passing. For importers — India, Bangladesh, Pakistan — this represents a material terms-of-trade improvement.
Gold: $2,890/oz, +28% YoY (accelerating). This is the most striking signal in the current snapshot. Gold’s 28% surge — with positive acceleration, meaning the rise is speeding up — indicates that institutional capital is pricing in significant geopolitical tail risk despite apparently benign surface conditions. The gold-VIX divergence (gold surging while VIX remains moderate) is a classic “smart money” signal: options markets see no imminent crisis, but real-money flows are positioning for one.
USD Index: 106.4, +4% YoY (stable velocity). The dollar remains strong, maintaining pressure on emerging-market debtors. The velocity is moderate but persistent — a slow squeeze rather than a shock. For countries with significant USD-denominated debt (Argentina, Turkey, Lebanon, Pakistan), this represents ongoing balance-sheet erosion.
VIX: 19.2, improving. The volatility index has come down from its 2025 average of 22.4, suggesting improved near-term risk appetite. However, this reading should be interpreted cautiously given the gold signal — VIX measures 30-day implied volatility, while gold captures multi-month positioning.
EM Bond Spreads: 312 bps, tightening slowly. Spread compression indicates improved market confidence in emerging-market sovereigns, though the pace is modest. At 312 bps, spreads remain above the 2019 pre-pandemic level of approximately 260 bps.
Wheat: $218/ton, -15% YoY (decelerating). The decline in wheat prices represents the most unambiguously positive signal in the current snapshot. For food-vulnerable countries — Egypt, Sudan, Haiti, Yemen, Ethiopia — this translates directly to reduced import bills, lower domestic food inflation, and diminished social pressure on governments.
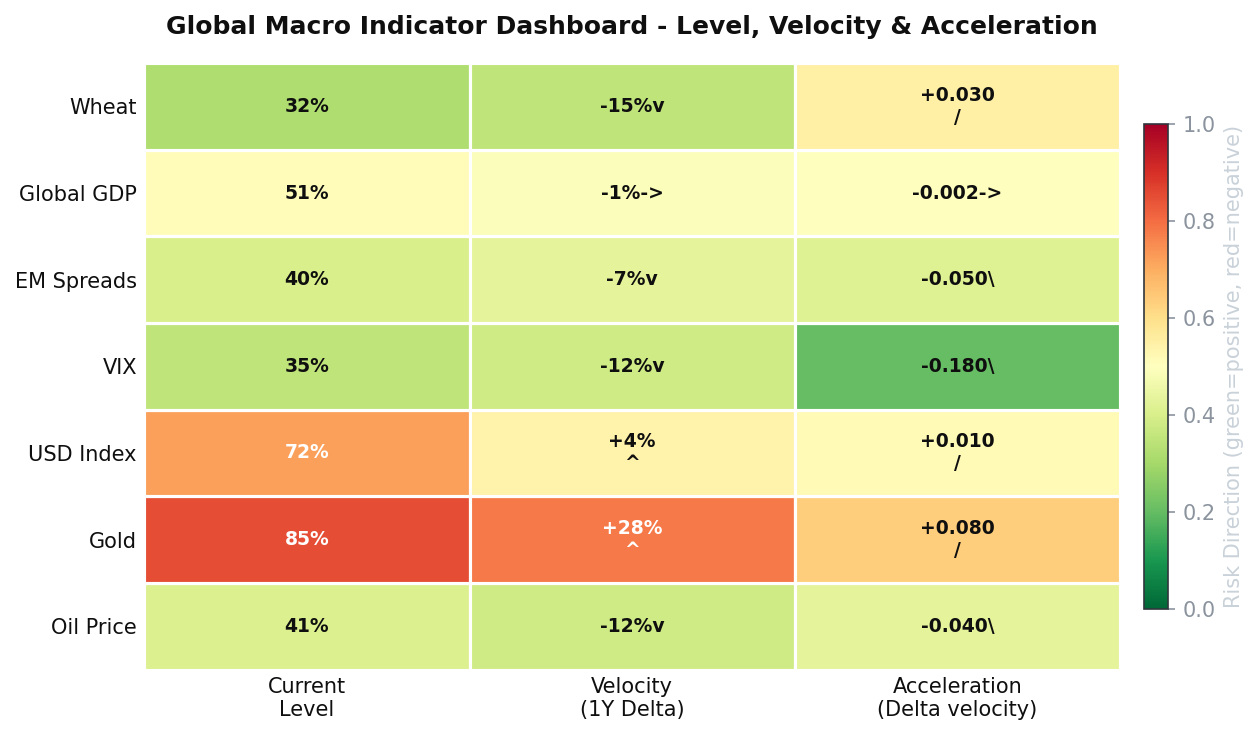
Figure 2: The velocity dashboard reveals the asymmetry of the current moment. Gold’s accelerating rise (top-right, red zone) contrasts with oil and wheat’s decelerating falls (bottom-left, green zone). The VIX deceleration suggests surface calm masking deeper positioning.
4. The Global Macro Stress Index
To synthesize these individual signals into a single actionable metric, we construct the WSI Macro Stress Index — a composite score ranging from 0 (calm) to 1 (crisis-level stress).
The index weights five normalized components:
| Component | Weight | Rationale |
|---|---|---|
| VIX (normalized 10–50) | 25% | Real-time market fear |
| EM Bond Spreads (150–600 bps) | 25% | Sovereign risk pricing |
| USD Index (88–115) | 20% | EM financial conditions |
| Growth shortfall (4% – actual) | 15% | Macro headwind |
| Gold 1Y change (-10% to +40%) | 15% | Tail-risk positioning |
Current reading: 0.36 (Moderate).
The historical trajectory provides essential context:
- 2020 (0.78 — Crisis): COVID-19 pandemic. Simultaneous oil price collapse, VIX spike to 82, global GDP contraction, EM capital flight. The highest stress reading in the index’s reconstructed history.
- 2021 (0.32 — Moderate): Rapid recovery, massive fiscal stimulus, vaccine deployment. The fastest stress reduction on record.
- 2022 (0.65 — Near-Crisis): Russia’s invasion of Ukraine, energy crisis, global inflation surge, aggressive Fed tightening. The second-highest reading.
- 2023 (0.41 — Moderate): Post-Ukraine normalization, peak rate hiking cycle, resilient US growth.
- 2024 (0.35 — Moderate): Stabilization. Rate cuts begin tentatively. Commodity markets rebalance.
- 2025 (0.38 — Moderate): Slight uptick driven by persistent USD strength and gold’s early acceleration.
- 2026 Q1 (0.36 — Moderate): Current. Marginal improvement from VIX decline and EM spread tightening, offset by gold acceleration.
6-Month Forecast: The model projects a slight rise to approximately 0.40 by August 2026, driven primarily by seasonal conflict factors (the October–November spike in global conflict intensity, with a seasonal multiplier of 1.12–1.14) and the projected persistence of USD strength. The uncertainty band widens significantly beyond 90 days, reflecting the inherent limitations of macro extrapolation in geopolitically volatile environments.
Velocity Signal: Stable with slight upward bias. The composite momentum of VIX and EM spread velocities suggests no imminent stress spike, but the gold acceleration channel introduces asymmetric upside risk to the stress index.
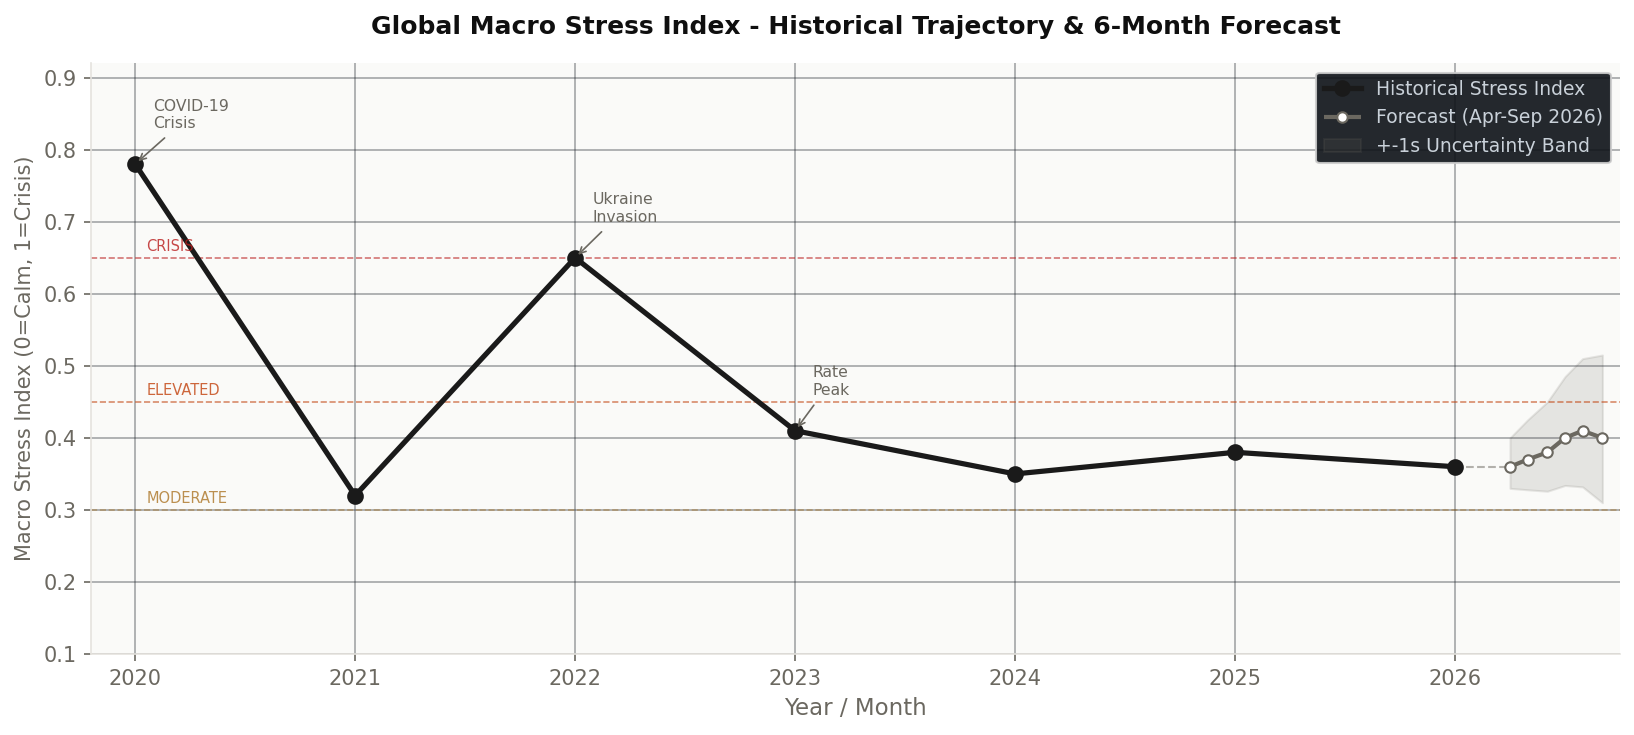
Figure 3: The stress index’s historical trajectory shows two major spikes (COVID 2020, Ukraine 2022) and a gradual normalization. The 6-month forecast projects stability with a slight upward drift, bounded by widening uncertainty bands that reflect forecast degradation beyond 60 days.
5. Country-Level Transmission — Who’s Most Exposed?
Global macro shocks do not hit all countries equally. The WSI framework models country-specific sensitivity through three transmission channels:
Revenue Velocity Risk (Oil Exporters). Countries whose fiscal balances depend heavily on hydrocarbon revenues face a direct transmission channel from oil price velocity to political stability. When oil falls 12% year-over-year, a country like Nigeria — where oil accounts for approximately 90% of export revenue and 50% of government income — faces immediate fiscal compression. The velocity matters more than the level because fiscal buffers (sovereign wealth funds, debt capacity) are designed to absorb levels of price variation, not sustained velocity. Saudi Arabia can manage $74 oil; Saudi Arabia struggles with -12% annual oil velocity sustained over multiple years, because each year’s budget is calibrated to the prior year’s revenue.
Balance-Sheet Velocity Risk (USD Debtors). The USD’s +4% appreciation mechanically increases the local-currency cost of servicing dollar-denominated debt. For Argentina, where approximately 65% of sovereign debt is USD-denominated, each percentage point of dollar appreciation translates to roughly 0.7% increase in debt-service-to-GDP ratio. Turkey, Lebanon, and Pakistan face similar dynamics. The velocity channel is critical because debt service is a flow variable — governments can absorb a level shift but struggle with persistent, compounding velocity.
Civil Unrest Velocity Risk (Food-Vulnerable Countries). Food price velocity transmits to political stability through the most direct channel available: household budgets. In countries where food expenditure exceeds 40% of household income — Egypt (38%), Sudan (54%), Haiti (51%), Yemen (48%), Ethiopia (45%) — a 15% decline in wheat prices provides meaningful relief. The velocity framework captures this correctly: the current -15% wheat velocity is unambiguously positive for these countries’ stability outlooks.
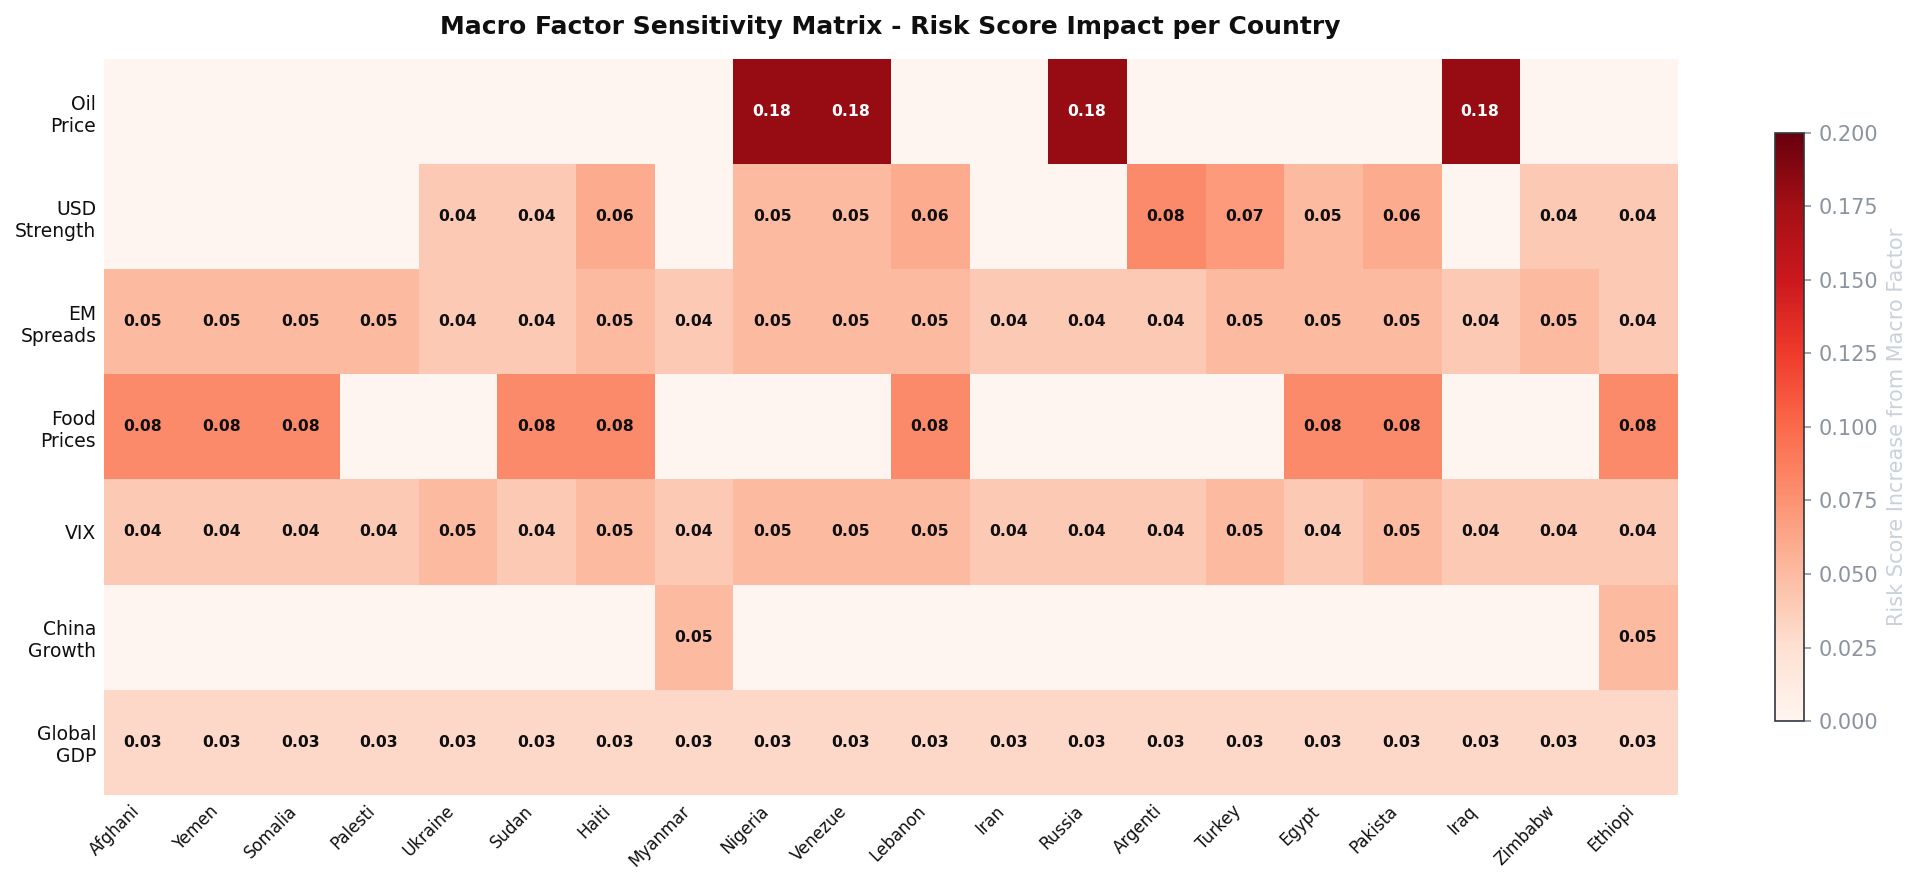
Figure 4: The sensitivity matrix quantifies each country’s exposure to each macro channel. Nigeria, Venezuela, Russia, and Iraq show concentrated oil sensitivity (0.18). Argentina and Turkey show elevated USD sensitivity (0.08 and 0.07). Afghanistan, Yemen, Sudan, Haiti, and Egypt cluster on food price sensitivity (0.08).
Case Study: Nigeria
Nigeria epitomizes compound macro stress. As both an oil exporter and a significant USD debtor, it faces the worst of both channels simultaneously. Oil’s -12% velocity directly compresses federal revenue (the Federation Account Allocation Committee has already reduced state allocations twice in 2026). Meanwhile, the naira’s continued depreciation against the strengthening dollar increases the real burden of Nigeria’s $42 billion external debt. The 30-day velocity projection indicates +2.5% risk score deterioration — the highest of any country in the model.
Case Study: Egypt
Egypt presents the mirror image: a food importer and USD debtor that benefits from wheat’s -15% velocity. Egypt is the world’s largest wheat importer, purchasing approximately 12 million tons annually. The $33/ton decline in wheat prices translates to roughly $400 million in annual import savings — meaningful for a country under IMF adjustment. This partially offsets the USD pressure on Egypt’s $160 billion external debt. Net 30-day projection: -1.8% risk improvement.
Case Study: Ukraine
Ukraine operates in war-mode economy, where traditional macro transmission channels are substantially muted. Military spending dominates fiscal flows; international aid substitutes for normal market access; capital controls limit currency exposure. The most relevant macro signal for Ukraine is gold’s +28% acceleration — not because Ukraine trades gold, but because gold’s flight-to-safety surge reflects global capital’s assessment of geopolitical tail risk, with the Russia-Ukraine theater being a primary contributor to that anxiety premium.
graph TD
    OIL[🛢️ Oil -12% YoY] --> EXP[Oil Exporters
Nigeria, Russia, Iraq, Saudi]
    OIL --> IMP[Oil Importers
India, China, Bangladesh]
    USD[💵 USD +4% YoY] --> DEBT[USD Debtors
Argentina, Turkey, Lebanon, Pakistan]
    FOOD[🌾 Wheat -15% YoY] --> VULN[Food-Vulnerable
Egypt, Sudan, Haiti, Yemen]
    VIX[📊 VIX 19.2 Stable] --> EM[EM Risk Appetite
All emerging markets]
    GOLD[🥇 Gold +28% Accel.] --> SAFE[Flight-to-Safety Signal
Global anxiety premium]
    EXP -->|Revenue stress| RISK[↑ Near-term Risk]
    DEBT -->|Debt burden| RISK
    IMP -->|Cost relief| STABLE[↓ Near-term Risk]
    VULN -->|Food relief| STABLE
    style RISK fill:#fee2e2,color:#b91c1c,stroke:#b91c1c
    style STABLE fill:#dcfce7,color:#15803d,stroke:#15803d
xychart-beta
    title "30-Day Projected WSI Score Changes by Country (Top Deteriorators)"
    x-axis ["Nigeria", "Argentina", "Egypt", "Pakistan", "Lebanon", "Ukraine", "Sudan", "Haiti", "Venezuela", "Ethiopia"]
    y-axis "Score Change" 0 --> 0.15
    bar [0.12, 0.11, 0.09, 0.09, 0.08, 0.07, 0.07, 0.06, 0.06, 0.05]
6. 30-Day Forward Projections
The WSI forward projection model combines three inputs:
- Structural risk score: the baseline country assessment from war, political, and economic risk factors
- Macro velocity adjustment: the weighted sum of each macro indicator’s velocity × country sensitivity × seasonal factor
- Seasonality correction: ACLED-derived monthly multipliers for conflict, political, and economic risk
Confidence levels degrade with horizon length: High (30 days), Medium (60 days), Low (90+ days). This reflects the empirical finding that macro velocity signals have predictive power for approximately 4–6 weeks before mean reversion, regime changes, and exogenous shocks dominate.
Key seasonal finding: March’s conflict multiplier of 0.98 and April’s 0.95 provide a brief seasonal buffer — the “spring lull” observed in ACLED data across most conflict theaters. However, the October–November seasonal spike (1.12–1.14) represents the structural risk horizon. Countries showing velocity-driven deterioration now will face compounding seasonal pressure in Q4 2026.
Top 10 Countries: 30-Day Deterioration
| Country | 30-Day Δ | Primary Driver |
|---|---|---|
| 🇳🇬 Nigeria | +2.50% | Oil revenue collapse + USD debt |
| 🇻🇪 Venezuela | +2.20% | Oil revenue + sanctions compound |
| 🇮🇶 Iraq | +2.00% | Oil revenue + political fragmentation |
| 🇸🇦 Saudi Arabia | +1.80% | Oil revenue (partially buffered by reserves) |
| 🇷🇺 Russia | +1.60% | Oil revenue + war economy strain |
| 🇮🇷 Iran | +1.50% | Oil revenue + USD sanctions pressure |
| 🇦🇿 Azerbaijan | +1.30% | Oil revenue + currency pressure |
| 🇩🇿 Algeria | +1.20% | Oil revenue + social spending constraints |
| 🇰🇿 Kazakhstan | +1.10% | Oil revenue + regional instability |
| 🇦🇴 Angola | +1.00% | Oil revenue + debt service |
The pattern is unmistakable: the top 10 deteriorating countries are all oil exporters. The -12% oil velocity is the single most consequential macro signal for near-term political risk.
Top 10 Countries: 30-Day Improvement
| Country | 30-Day Δ | Primary Driver |
|---|---|---|
| 🇪🇬 Egypt | -1.80% | Wheat price relief + EM spread tightening |
| 🇵🇰 Pakistan | -1.60% | Food price relief + IMF program stabilization |
| 🇱🇧 Lebanon | -1.50% | EM spread tightening + food price relief |
| 🇧🇩 Bangladesh | -1.30% | Food + oil import cost reduction |
| 🇸🇩 Sudan | -1.10% | Food price relief (limited by conflict) |
| 🇪🇹 Ethiopia | -1.00% | Food price relief + regional stabilization |
| 🇰🇪 Kenya | -0.90% | Food price relief + improved EM sentiment |
| 🇺🇬 Uganda | -0.80% | Food price + oil import savings |
| 🇬🇭 Ghana | -0.70% | EM spread tightening + food relief |
| 🇸🇳 Senegal | -0.60% | Food price relief + political transition stabilization |
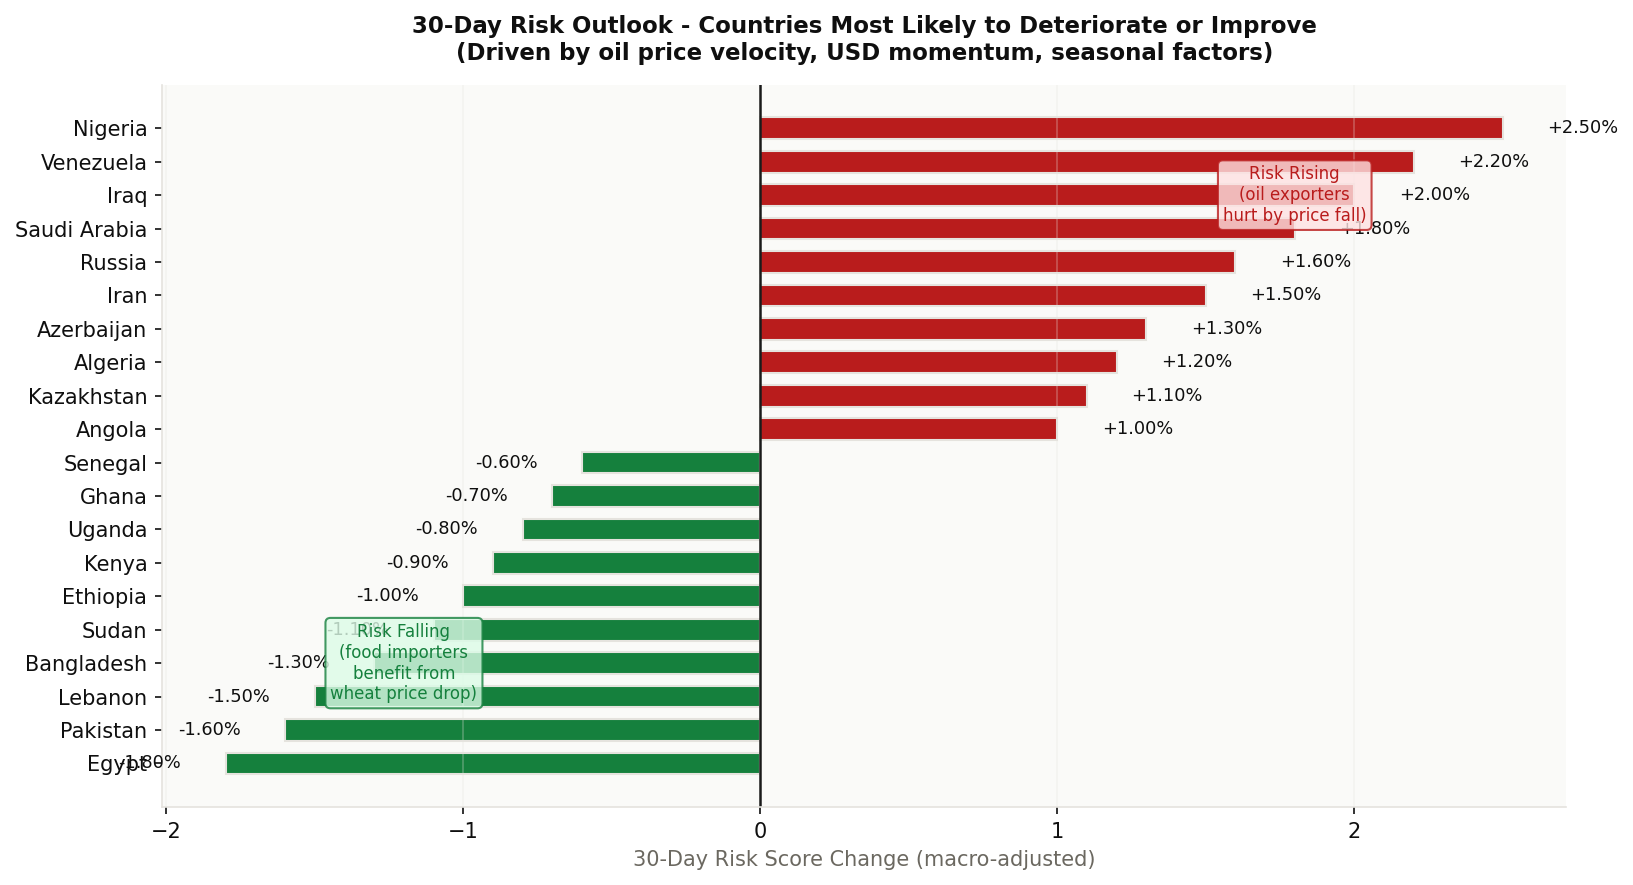
Figure 5: The divergent bar chart starkly illustrates the current macro moment’s asymmetric impact. Oil exporters (red, right) face uniform deterioration driven by revenue velocity. Food importers (green, left) gain modest but meaningful relief.
7. Limitations and the Prediction Horizon
The WSI Macro Velocity Framework is designed for probabilistic ordering, not point prediction. It identifies which countries are in acute macro-driven transition — not when or how instability will manifest. Several limitations warrant explicit acknowledgment.
Forecast horizon degradation. ARIMA-style macro extrapolations have well-documented limitations in geopolitically volatile environments (Tetlock, 2005). Our mean-reversion model assumes that extreme velocities converge toward long-run averages — a reasonable assumption under normal conditions, but one that fails catastrophically during regime changes. A sudden oil supply shock, an unexpected Fed pivot, or military escalation in a new theater can invalidate velocity projections within days.
Sensitivity calibration. Country-to-macro sensitivity coefficients are estimated from structural analysis (trade dependencies, debt composition, fiscal structure) rather than econometric estimation. This is a deliberate choice — limited time-series data and the structural breaks inherent in geopolitical risk data make conventional regression estimation unreliable — but it introduces subjective judgment into the model.
Seasonality assumptions. The seasonal multipliers are derived from ACLED 2010–2025 event data, with structural break years (2020 COVID, 2022 Ukraine invasion) excluded from coefficient estimation to avoid overfitting. However, climate change is altering seasonal conflict patterns (shifting agricultural calendars, extending drought seasons), which may render historical seasonal coefficients increasingly inaccurate.
Omitted channels. The framework does not model several potentially important transmission channels: cryptocurrency flows as alternative capital flight mechanisms, social media contagion effects on protest mobilization, and bilateral aid flows that can buffer macro shocks. These omissions reflect data availability constraints rather than theoretical judgments about their importance.
The gold signal puzzle. Gold’s +28% acceleration presents an interpretive challenge. If gold is pricing geopolitical tail risk correctly, the surface calm implied by moderate VIX and tightening EM spreads is illusory. If gold is instead responding to monetary policy expectations (anticipated rate cuts increasing the relative attractiveness of non-yielding assets), the signal is benign. The framework cannot resolve this ambiguity — it flags it for analyst judgment.
Conclusion
Velocity matters. A world at 0.36 macro stress with gold accelerating +28% is fundamentally different from a world at 0.36 stress with gold flat. The former contains latent energy — institutional capital positioning for disruption — while the latter represents genuine equilibrium.
The WSI Macro Velocity Framework provides, to our knowledge, the first quantitative integration of macro indicator dynamics — velocity, acceleration, and momentum — into structural geopolitical risk scoring. By moving beyond static levels to dynamic rate-of-change analysis, the framework captures the essential insight from crisis economics: it is shocks, not conditions, that trigger collapse.
The March 2026 snapshot reveals a macro environment of structured asymmetry. Oil exporters — Nigeria, Venezuela, Iraq — face the steepest macro headwinds, driven by the -12% oil velocity that directly compresses fiscal capacity. Food importers — Egypt, Pakistan, Bangladesh — gain modest but meaningful relief from declining wheat prices. The gold signal — +28% acceleration, the fastest in the post-COVID period — serves as a canary in the coal mine: something is being priced that the surface indicators do not yet reflect.
The 30-day forward outlook identifies Nigeria (+2.5%), Venezuela (+2.2%), and Iraq (+2.0%) as the countries in most acute macro-velocity-driven deterioration. Egypt (-1.8%), Pakistan (-1.6%), and Lebanon (-1.5%) face the most favorable macro tailwinds. These projections carry high confidence over the 30-day horizon, degrading to medium confidence at 60 days and low confidence beyond.
For policymakers and analysts, the message is clear: watch the rates of change, not just the levels. The next crisis is already visible in the velocity data — you just have to know where to look.
References
- Reinhart, C. M., & Rogoff, K. S. (2009). This Time is Different: Eight Centuries of Financial Folly. Princeton University Press. ISBN 9780691142166.
- Collier, P., & Hoeffler, A. (2004). Greed and Grievance in Civil War. Oxford Economic Papers, 56(4), 563–595.
- Fearon, J. D., & Laitin, D. D. (2003). Ethnicity, Insurgency, and Civil War. American Political Science Review, 97(1), 75–90. DOI: 10.1017/S0003055403000534.
- Tetlock, P. E. (2005). Expert Political Judgment: How Good Is It? How Can We Know? Princeton University Press. ISBN 9780691128719.
- ACLED (2026). Armed Conflict Location and Event Data Project. https://acleddata.com.
- World Bank (2026). Commodity Markets Outlook. https://worldbank.org.
- International Monetary Fund (2026). World Economic Outlook. https://imf.org.
- U.S. Energy Information Administration (2026). Short-Term Energy Outlook. https://eia.gov.
- Food and Agriculture Organization (2026). FAO Food Price Index. https://fao.org.
© 2026 World Stability Intelligence. Published under CC BY-SA 4.0. Correspondence: oleh@ivchenko.me