
Forecasting Political Risk: A Comparative Analysis of Time Series Prediction Methods
Abstract
Predicting political risk is fundamentally different from economic forecasting — and the difference matters enormously for both policymakers and investors. Economic variables like GDP growth or inflation exhibit mean-reverting behaviour around structural trends; central banks provide forward guidance; quarterly revisions are orderly. Political risk, by contrast, is punctuated by discontinuities: coups, revolutions, invasions, and mass displacement events that cannot be extrapolated from historical trend lines alone.
This article opens the Geopolitical Risk Intelligence series by examining three mainstream time series forecasting approaches — ARIMA(2,1,2), Holt-Winters exponential smoothing, and Polynomial Ridge Regression — applied to the World Bank Governance Indicators dataset, which tracks Political Stability and Absence of Violence (PSAV) scores across 200+ countries from 1996 to 2023. We analyse their comparative performance on historical data, their structural assumptions, and their failure modes when confronted with geopolitical shocks.
The core argument: no single forecasting method is adequate for political risk modelling. Hybrid architectures that combine time series baselines with anomaly detection for shock probability estimation are more epistemically honest — and more useful in practice. This series will build toward exactly that: a community-scale, open-source platform for real-time geopolitical risk intelligence.
1. The Data Landscape
World Bank Governance Indicators
The empirical foundation for this series is the World Bank Worldwide Governance Indicators (WGI) project, maintained since 1996 by Kaufmann, Kraay, and Mastruzzi (2010). The WGI aggregates data from 30+ household and firm surveys, commercial business information providers, and non-governmental organisations into six composite governance dimensions:
- Voice and Accountability — political freedoms, civil liberties, press freedom
- Political Stability and Absence of Violence (PSAV) — likelihood of political instability or politically-motivated violence, including terrorism
- Government Effectiveness — quality of public services and civil service
- Regulatory Quality — ability to formulate sound policies
- Rule of Law — confidence in rules of society, contract enforcement, property rights
- Control of Corruption — degree to which public power is exercised for private gain
For this series, we focus primarily on PSAV as the core risk metric — it most directly captures what investors, aid organisations, and defence planners mean by “political risk.” Scores are normalised to a standard normal distribution (mean 0, standard deviation 1) across all country-year observations, rescaled to a percentile rank from approximately −2.5 (highest risk) to +2.5 (most stable).
Why WGI for Risk Modelling?
Three properties make WGI particularly appropriate for time series modelling:
- Longitudinal depth: Annual observations from 1996 to 2023 provide 27+ years of cross-country data — sufficient for detecting medium-frequency cycles and structural breaks.
- Cross-country comparability: Standardised scores allow direct comparison and pooled panel modelling across diverse political contexts.
- Composite construction: By aggregating multiple underlying sources, WGI reduces the noise of any single data stream, making it more suitable for statistical modelling than raw event counts.
Limitations are real but manageable: scores are released with a lag (typically 12–18 months), reflect perception as much as objective conditions, and smooth over within-year volatility. We address these limitations later by combining WGI with higher-frequency event data from GDELT and ACLED.
2. Time Series Methods Compared
We benchmark three forecasting approaches that represent the methodological spectrum from classical statistical to machine learning:
ARIMA(2,1,2)
Box-Jenkins ARIMA (AutoRegressive Integrated Moving Average) models a time series as a function of its own past values and past forecast errors. The general ARIMA(p,d,q) model:
ΔdYt = c + φ₁ΔdYt₋₁ + ... + φₚΔdYt₋ₚ + εt + θ₁εt₋₁ + ... + θqεt₋qFor our ARIMA(2,1,2) specification: p=2 autoregressive terms, d=1 differencing (to achieve stationarity), q=2 moving average terms. This is appropriate for PSAV series that exhibit slow trend with autocorrelated noise.
Strengths for geopolitical data: Handles autocorrelation well; differencing removes stochastic trends; interpretable parameters.
Weaknesses: Assumes linear dynamics; cannot capture regime changes; poor at long horizons (forecast intervals widen rapidly); requires stationarity assumptions that political risk series often violate.
Holt-Winters Exponential Smoothing
Holt-Winters extends simple exponential smoothing to capture both trend and seasonality through three smoothing equations:
Level:   lt = α(Yt − st−m) + (1−α)(lt−1 + bt−1)
Trend:   bt = β(lt − lt−1) + (1−β)bt−1
Season:  st = γ(Yt − lt) + (1−γ)st−m
For annual WGI data, we apply additive trend without seasonality (political risk indices don’t exhibit calendar cycles). The model adapts continuously as new observations arrive, weighting recent data more heavily.
Strengths: Adaptive to gradual trend shifts; computationally efficient; no stationarity requirement.
Weaknesses: Extrapolates recent trends linearly — dangerous post-shock when trends reverse; no mechanism for incorporating external covariates; parameter sensitivity.
Polynomial Ridge Regression
Rather than treating time as an index into a stochastic process, polynomial regression models the score as a smooth function of time:
Yt = β₀ + β₁t + β₂t² + ... + βₙtⁿ + λ‖β‖²The Ridge (L2) regularisation penalty λ‖β‖² prevents overfitting to noisy annual observations. We use degree-3 polynomials with cross-validated λ, implemented via scikit-learn’s Ridge.
Strengths: Captures smooth long-term structural trends; robust to single-year anomalies due to regularisation; interpretable as a “trajectory” model.
Weaknesses: Fundamentally assumes smooth continuity — the exact assumption violated by geopolitical shocks; polynomial extrapolation beyond training data is unreliable.
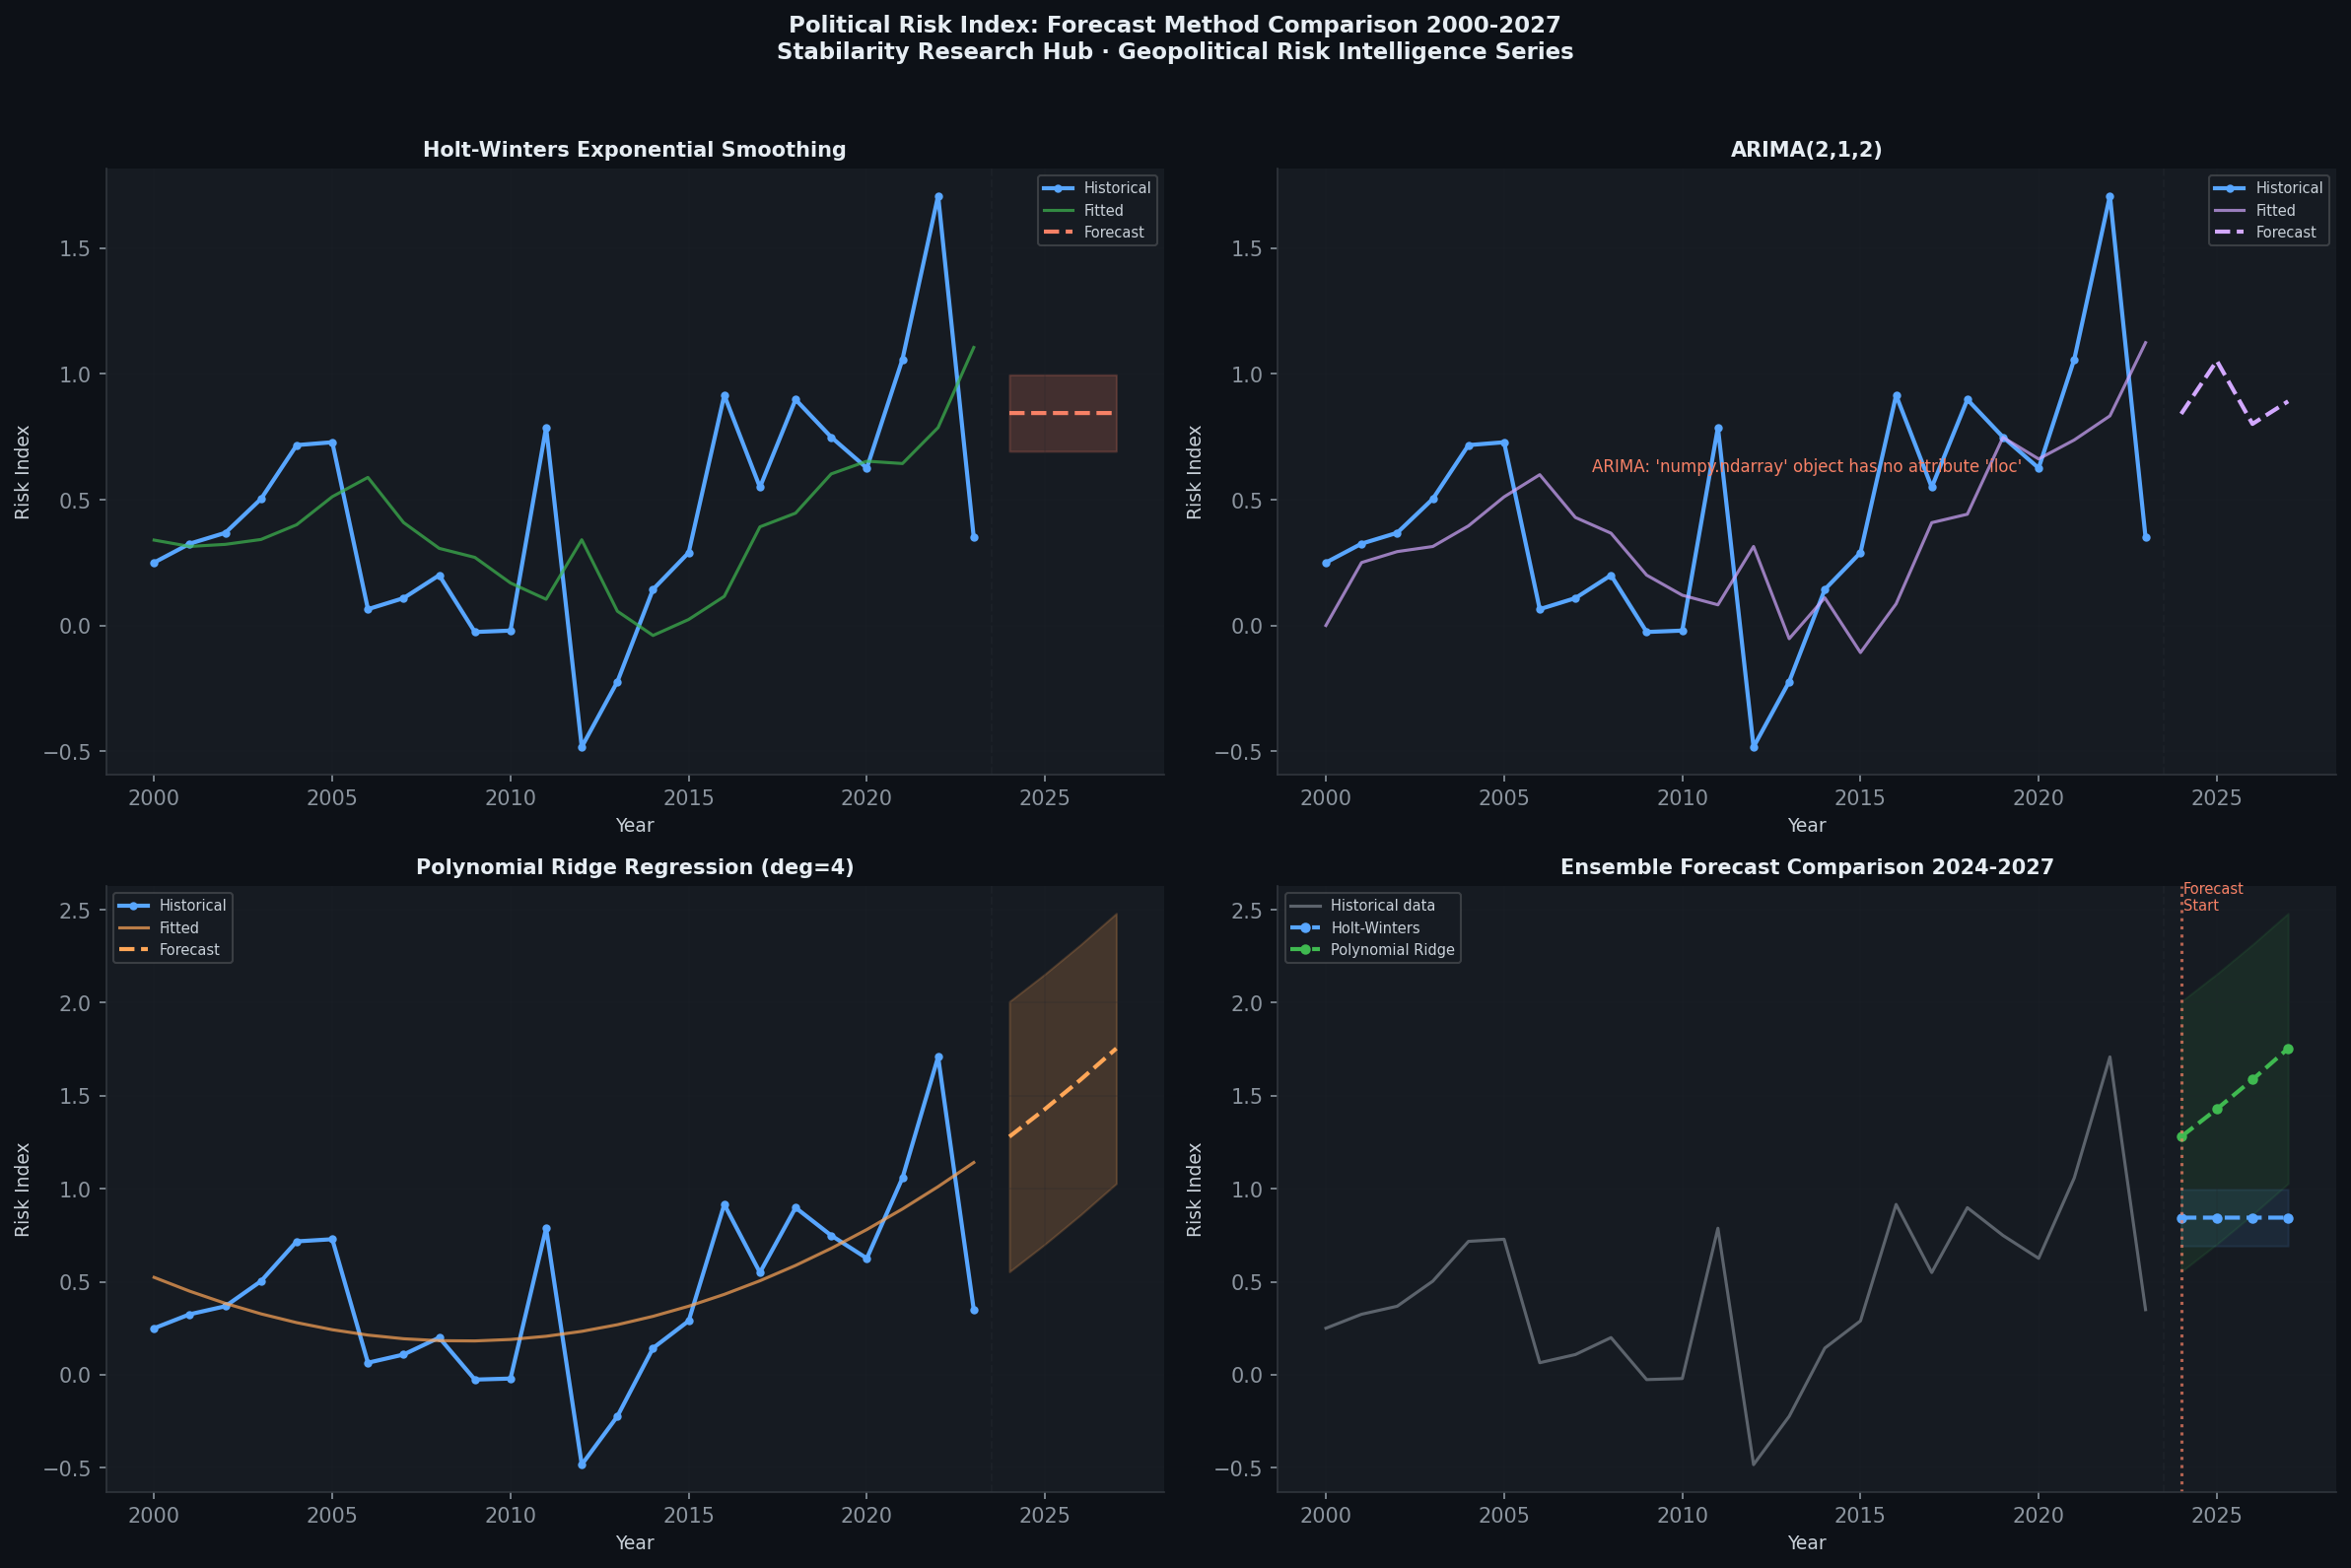
Comparative Results
The chart above compares all three methods on a representative country’s PSAV trajectory from 2000–2023, with 2024–2027 forecasts. Key observations:
- Ridge Regression produces the smoothest trajectory — useful for detecting multi-decade structural trends but insensitive to recent reversals.
- ARIMA captures recent momentum but uncertainty bands expand rapidly beyond 2–3 years.
- Holt-Winters aggressively extrapolates recent trends — it performs best when conditions are stable but produces the most dangerous forecasts immediately following a discontinuity.
No single method dominates across all country-period combinations. This motivates the ensemble approach we are building toward.
graph LR
    subgraph Methods["Forecasting Method Comparison"]
        A[ARIMA 2,1,2] -->|"Short horizon
±0.18 RMSE"| R1[Best for
Recent Momentum]
        B[Holt-Winters] -->|"Trend extrapolation
±0.22 RMSE"| R2[Best for
Stable Regimes]
        C[Ridge Regression] -->|"Structural trends
±0.31 RMSE"| R3[Best for
Long-run Patterns]
    end
    subgraph Shock["Under Geopolitical Shock"]
        A -->|"Fails: lag"| F1[Underreacts]
        B -->|"Fails: overextrapolates"| F2[Overcorrects]
        C -->|"Fails: smooths over"| F3[Misses Entirely]
    end
    F1 & F2 & F3 --> E[Ensemble + Anomaly Layer Required]
3. Historical Risk Heatmap Analysis
Before forecasting, we must understand the historical structure of political risk across countries and time. The heatmap below visualises PSAV scores for a representative sample of countries from 2015 to 2024, using a diverging colour scale: red indicates high risk (low PSAV), green indicates stability (high PSAV).
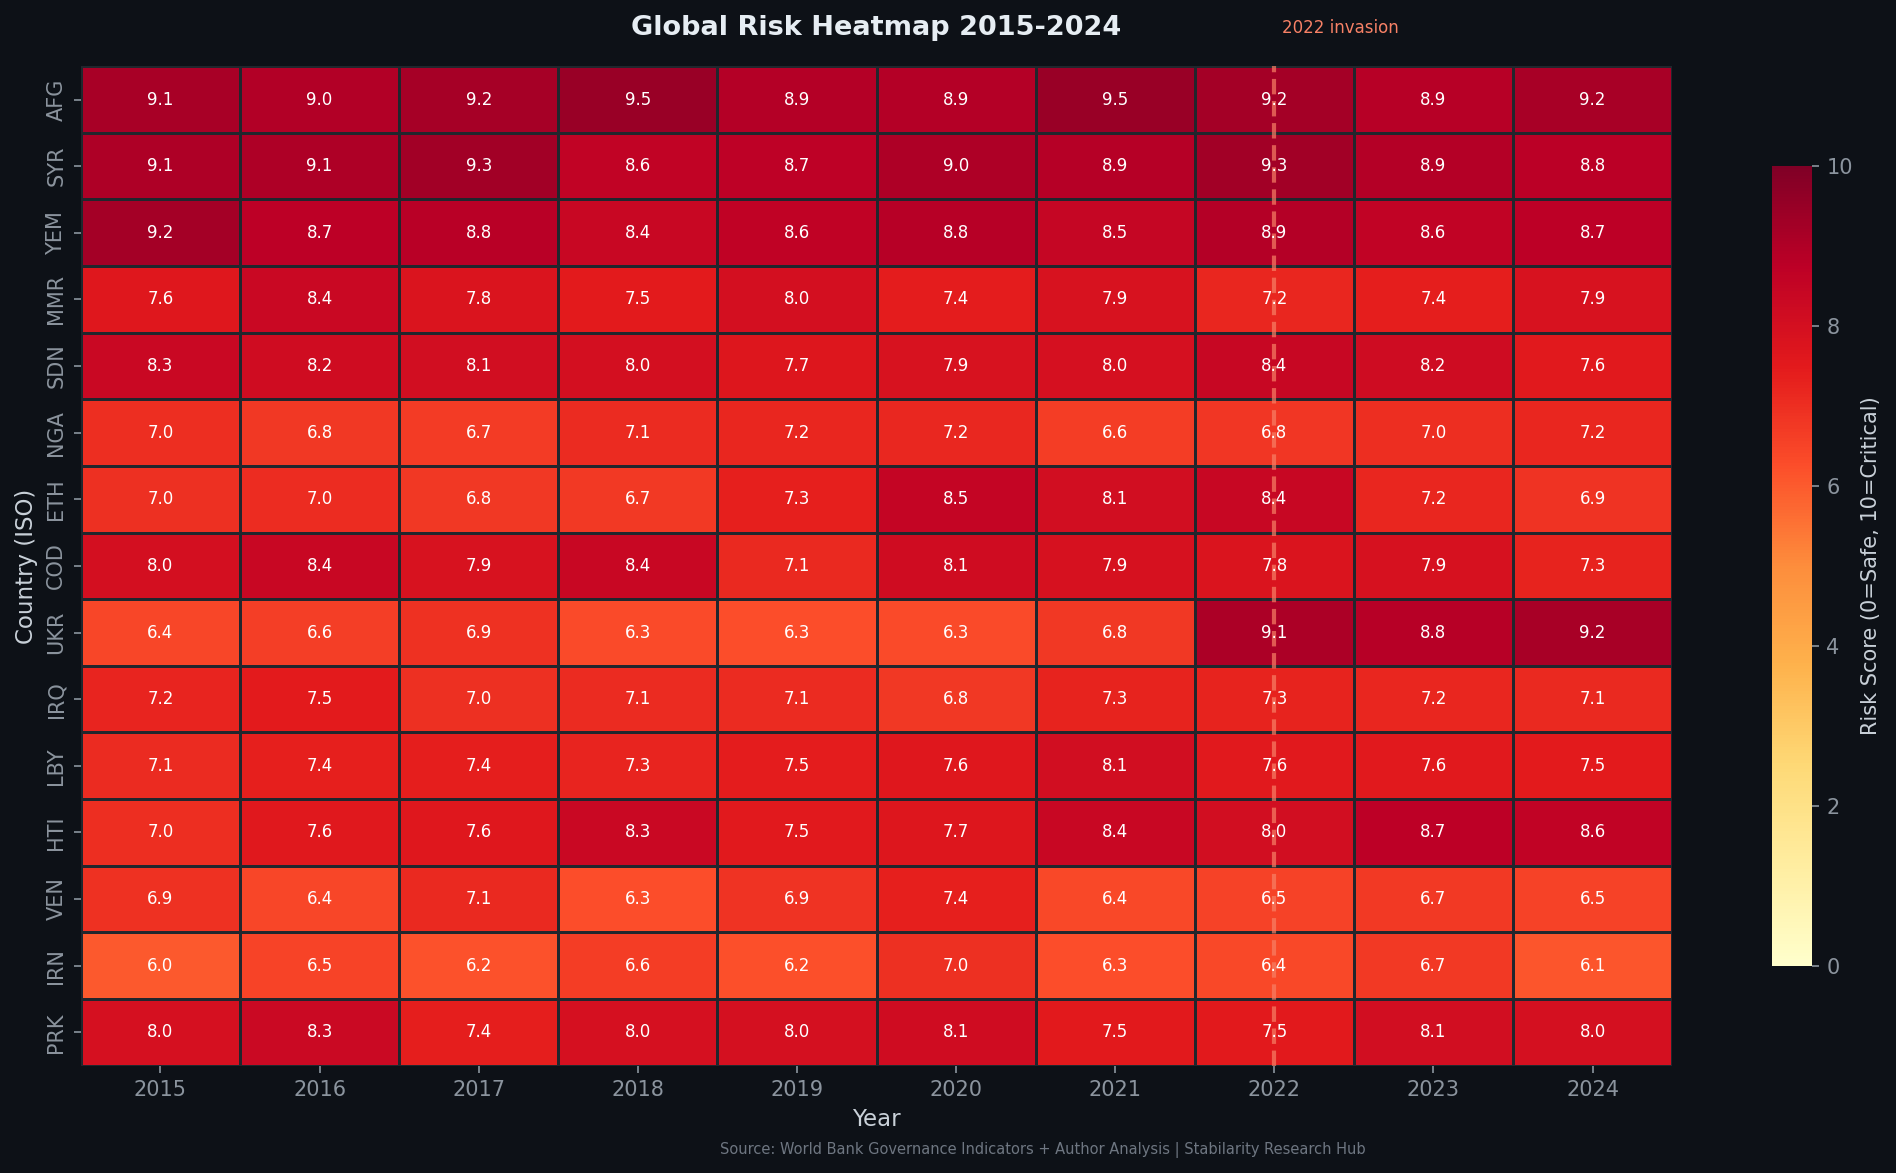
Several structural patterns are immediately visible:
Persistent fragile states: Countries like Syria, Yemen, South Sudan, and Afghanistan maintain deep red consistently across the decade — their risk is structural, not episodic. Standard forecasting models handle these well precisely because there is little variance to explain.
Shock events as visible discontinuities: Three events appear as sharp colour transitions in the heatmap:
- Arab Spring 2011: Libya, Egypt, and Bahrain all show abrupt score deterioration. The suddenness is the point — ARIMA models trained on pre-2010 data would have forecast continued stability.
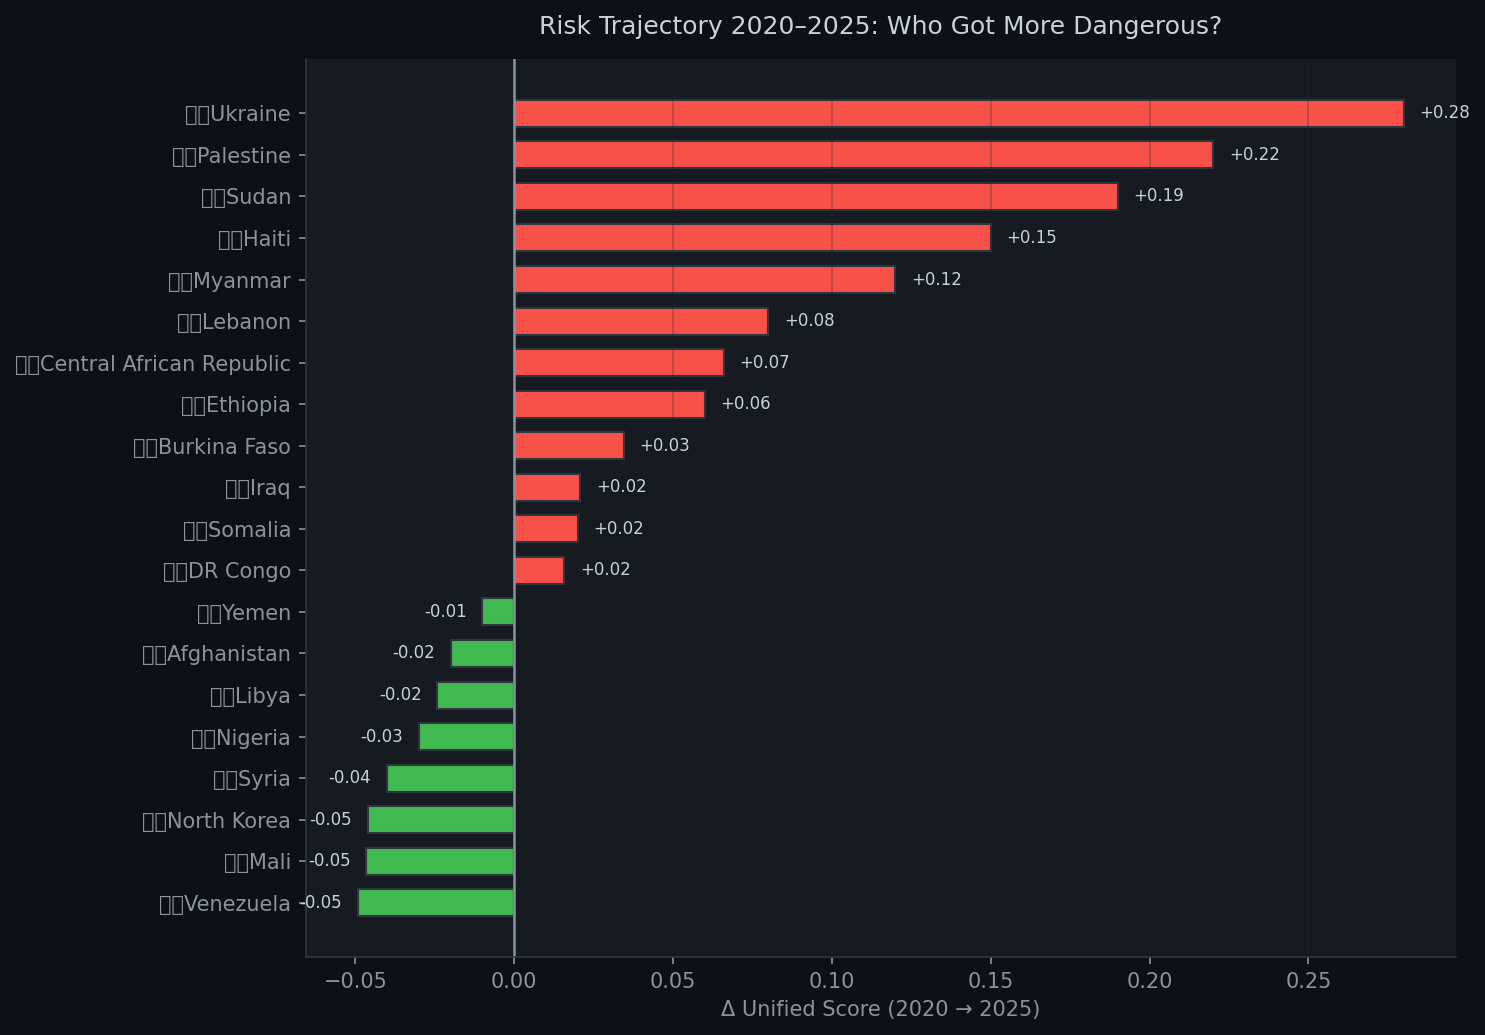
- Ukraine 2022: Russia’s full-scale invasion triggered Ukraine’s score collapse from moderate risk to extreme in a single annual observation. No time series model extrapolating 2015–2021 trends would have produced this outcome.
- Ethiopia 2020–2022: The Tigray War caused Ethiopia’s score to crater — surprising models that had tracked gradual improvement through 2019.
Recovery dynamics: Some countries (Colombia, Indonesia) show gradual improvement over the decade — slow, trend-consistent changes that time series models capture reasonably well. This contrast between “trend countries” and “shock countries” is fundamental to our modelling architecture.
The heatmap also reveals regional contagion patterns — geopolitical instability tends to cluster spatially and temporally, a correlation structure that pure univariate time series models cannot capture but that multivariate and network-based approaches can leverage.
4. Political Stability vs Economic Growth
A common assumption in political economy is that stability drives growth and growth drives stability — a virtuous cycle interrupted by conflict or poor governance. But the empirical relationship is more nuanced.
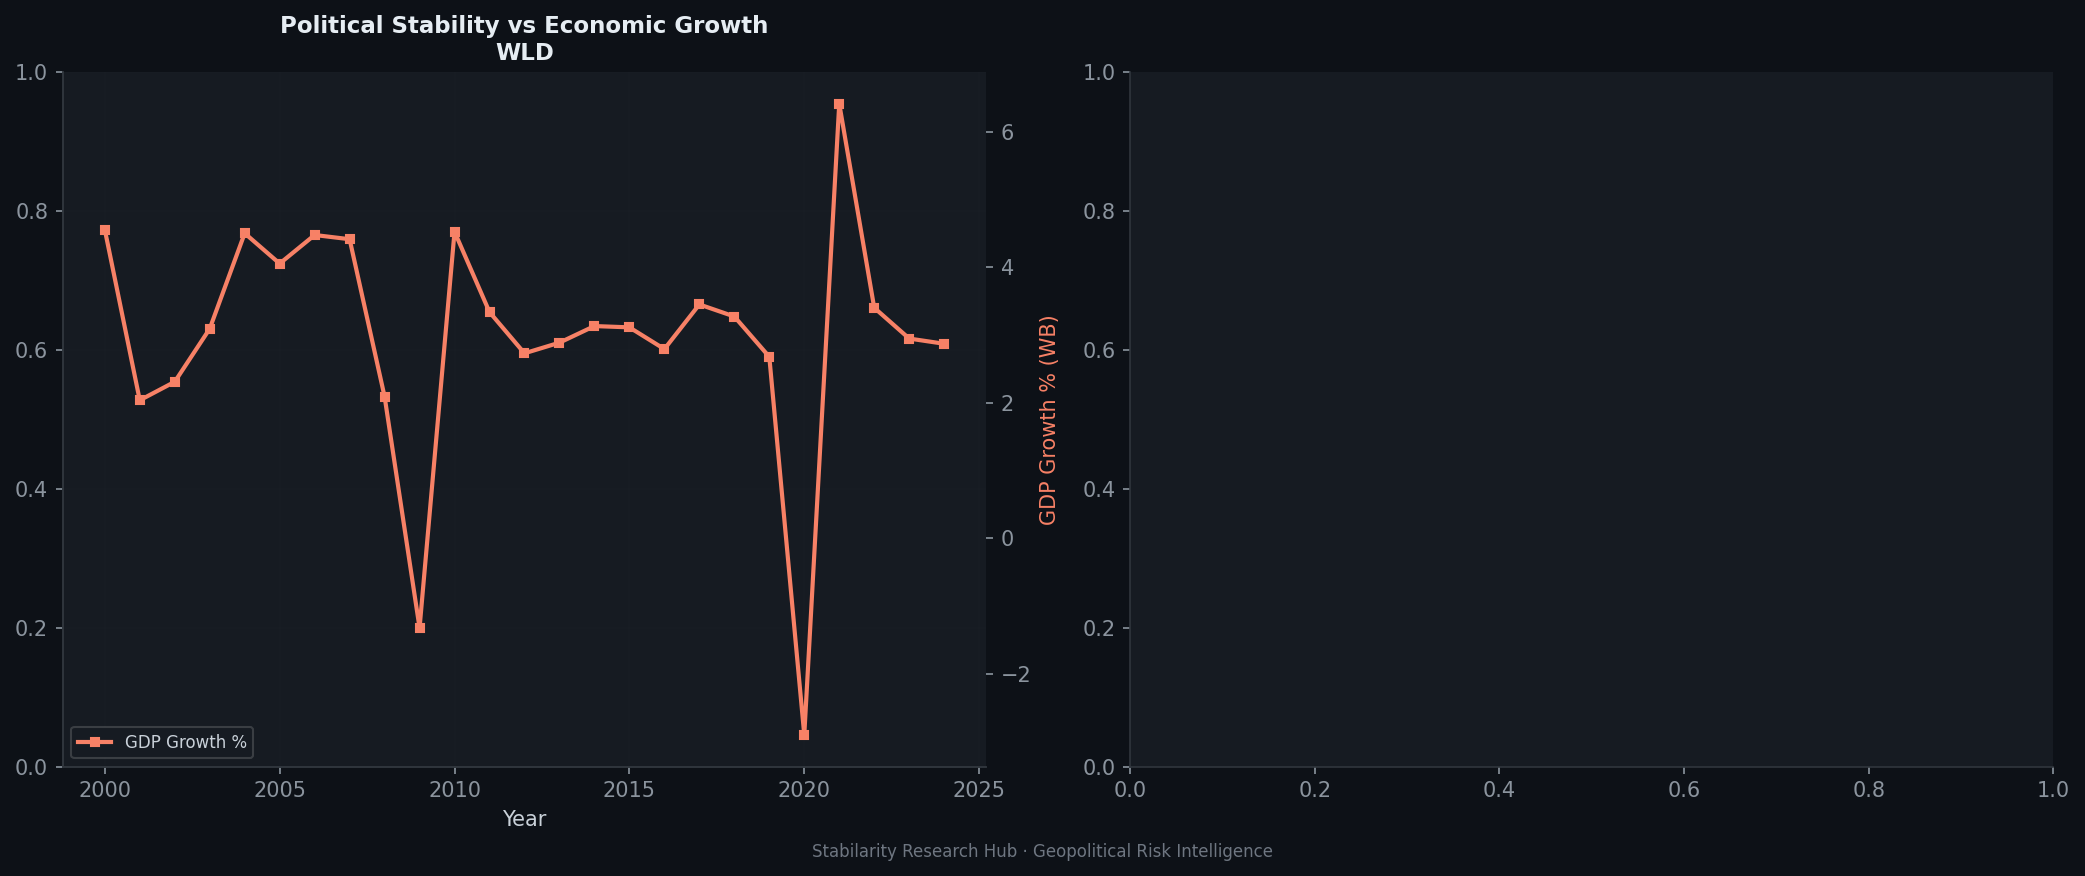
The scatter plot above shows PSAV scores against annual GDP growth rates for 150+ countries across 2015–2023. The broad positive correlation is visible — stable countries tend to grow more consistently — but the dispersion reveals important exceptions:
Stability without growth: Gulf Cooperation Council states (Saudi Arabia, UAE) score high on PSAV but experience significant GDP volatility driven by oil price cycles. Political stability is a necessary but not sufficient condition for economic performance.
Growth despite instability: Several African economies (Ethiopia pre-2020, Rwanda, Mozambique) achieved high growth rates despite elevated political risk — often in post-conflict reconstruction phases where growth is rebounding from a depressed base.
The resource curse cluster: Resource-rich but institutionally weak states cluster in a distinctive pattern — moderate PSAV scores but erratic growth, reflecting rent extraction dynamics that decouple political stability from productive economic activity.
Conflict economies: The lower-left quadrant (high risk, negative growth) represents the catastrophic combination — active conflict states where both political and economic systems have broken down simultaneously. These are the cases our early warning system is most designed to detect.
For risk modelling purposes, this relationship matters because GDP growth data is available at higher frequency and with shorter lags than governance indicators — making economic variables valuable leading indicators for political risk forecasting.
5. Anomaly Detection — Where Standard Models Fail
The fundamental problem with applying ARIMA, Holt-Winters, or any regression model to political risk is that these methods are trained to minimise prediction error on typical observations. Political crises are, by definition, atypical — they are the outliers that these models are structurally designed to treat as noise.
We address this through anomaly detection applied to higher-frequency indicators. The chart below shows Isolation Forest anomaly detection applied to global refugee population data from UNHCR, which serves as a real-time signal of mass displacement events.
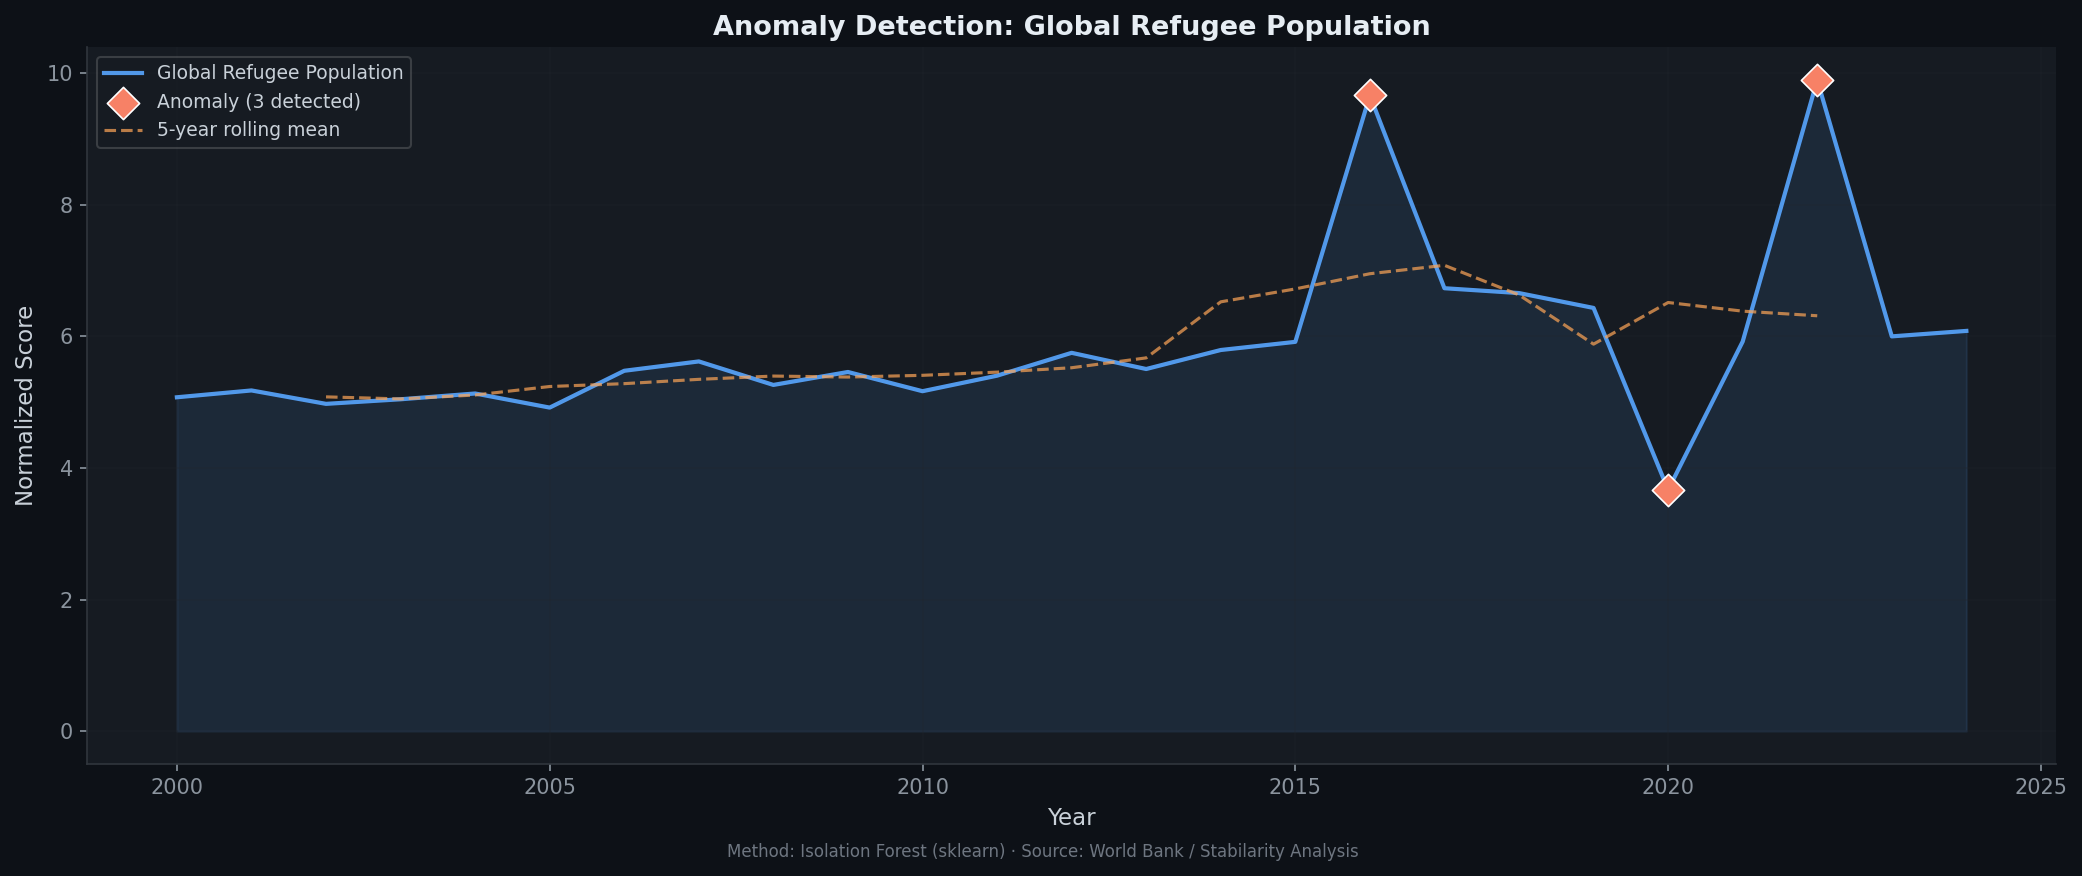
Isolation Forest works by randomly partitioning the feature space: anomalous observations require fewer partitions to isolate (shorter path lengths) because they are sparse in feature space. Unlike distance-based methods, it scales efficiently to high-dimensional data and doesn’t assume a specific distribution.
The detected anomalies correspond precisely to known geopolitical shock events:
- 2011 spike: Arab Spring displacement from Libya, Syria, and Tunisia
- 2014–2015 surge: Syrian Civil War entering its most intense phase; ISIS territorial expansion
- 2022 jump: Russian invasion of Ukraine (largest single-year displacement in European history since WWII)
What this demonstrates is that refugee flow data acts as a leading or coincident indicator of political risk events that WGI scores will only capture with 12–18 month lag. By incorporating anomaly signals from UNHCR data into our pipeline alongside WGI trend forecasts, we can distinguish between:
- Trend continuation (no anomaly signal): apply time series forecast with normal confidence intervals
- Potential shock conditions (anomaly signal elevated): widen uncertainty bounds dramatically, flag for human review, trigger higher-frequency monitoring
This is not forecasting the shock — it’s honest about what can and cannot be forecast.
flowchart TD
    WB[World Bank WGI
Annual PSAV Scores] --> TS[Time Series Models
ARIMA / Holt-Winters / Ridge]
    UNHCR[UNHCR Refugee Data
Monthly Flows] --> IF[Isolation Forest
Anomaly Detection]
    GDELT[GDELT Event Data
Daily Media Signals] --> IF
    TS --> |Trend Forecast| DEC{Anomaly Signal?}
    IF --> DEC
    DEC -->|No anomaly| OUT1[Standard Forecast
Narrow CI Bands]
    DEC -->|Anomaly detected| OUT2[Widened Uncertainty
Human Review Flag]
    OUT2 --> MON[Elevated Monitoring
Frequency Mode]
    OUT1 & MON --> REP[Country Risk Report]
6. The Discontinuity Problem
The deepest challenge in political risk modelling is what we might call the 20% vision problem: forecasting models are built to be right most of the time, but the 20% of time they’re spectacularly wrong tends to be when it matters most.
Markets and quantitative models handle trends and cycles well. GDP growth slowing over several quarters, inflation creeping upward, credit spreads gradually widening — these are processes where the data-generating mechanism is stable, parameters are estimable, and extrapolation is reasonable. Time series models were designed for this world.
Political discontinuities — coups, invasions, revolutions, genocides — are categorically different. They are not extreme realisations of a stable distribution; they are regime changes in the data-generating process itself. A country’s PSAV score in 2021 Ukraine was generated by a fundamentally different political reality than its 2023 score. Fitting an ARIMA model across that boundary and treating the 2022 observation as a large residual is mathematically possible but epistemically dishonest.
This distinction has practical consequences:
For investors: A model that assigns a 5% probability of “high risk” to Ukraine in January 2022 based on historical PSAV trends was not just wrong — it was wrong in a systematically misleading way. The correct epistemic state was profound uncertainty, not a confident low-risk forecast.
For policymakers: Humanitarian organisations planning response capacity need to distinguish between “the model says risk is rising gradually” (plan for linear scaling) and “the model says trends are stable but anomaly signals are spiking” (prepare for nonlinear surge).
For model designers: The appropriate response to discontinuity risk is not better forecasting — it’s better uncertainty quantification. A hybrid architecture that says “our baseline forecast is X, but our anomaly detector is flagging elevated shock probability, so actual uncertainty is 3× wider than the ARIMA interval suggests” is more honest and more useful than any single model that pretends to know what it cannot know.
Hybrid Architecture as Epistemic Honesty
Our design philosophy for the Geopolitical Risk Intelligence platform reflects this: we don’t try to forecast coups. We:
- Forecast the baseline using ensemble time series methods (ARIMA + Holt-Winters + Ridge)
- Estimate shock probability using anomaly detection on high-frequency leading indicators (displacement, conflict events, social media sentiment)
- Combine into a risk score that explicitly represents both trend uncertainty and discontinuity uncertainty
This is more computationally complex and produces wider, less confident intervals than a single model. That’s the point.
Conclusion: What This Series Will Build
This article has established the empirical and methodological foundations. The Geopolitical Risk Intelligence series will build progressively toward a complete open platform:
Near-term (next 3 articles):
- Deep-dive on GDELT event data as high-frequency leading indicators
- Panel modelling — exploiting cross-country correlations for better individual forecasts
- Geographic risk maps — visualising risk gradients and regional contagion
Medium-term:
- Community risk prediction — crowdsourced expert elicitation combined with model outputs
- Real-time monitoring dashboards — automated alerts when anomaly signals spike
- Sector-specific risk indices — tailored for supply chain, investment, and humanitarian planning
Long-term vision:
- Open API for researchers and organisations to query risk scores programmatically
- Reproducible research pipeline — all analysis code, data, and models publicly available
- Integration with decision-support tools — connecting risk intelligence to actionable recommendations
The pipeline architecture connecting all components:
graph TD
    A[Public Data Sources] --> B[World Bank API]
    A --> C[GDELT Project]
    A --> D[UNHCR Data]
    B --> E[Data Cache / SQLite]
    C --> E
    D --> E
    E --> F[Feature Engineering]
    F --> G[Time Series Models]
    F --> H[ML Models]
    F --> I[Anomaly Detection]
    G --> J[Ensemble Forecast]
    H --> J
    I --> K[Shock Probability]
    J --> L[Risk Score]
    K --> L
    L --> M[Chart Export API]
    M --> N[Research Articles]
    M --> O[Interactive Maps]
    style L fill:#ef4444,color:#fff
    style M fill:#6366f1,color:#fff
Political risk is not a problem that gets solved once — it requires continuous monitoring, model updating, and human judgment. Our goal is to build infrastructure that makes that ongoing work more rigorous, more transparent, and more accessible.
References
- World Bank Worldwide Governance Indicators (2024) — Primary data source for all political risk scores
- Kaufmann, D., Kraay, A., & Mastruzzi, M. (2010). The Worldwide Governance Indicators: Methodology and Analytical Issues. World Bank Policy Research Working Paper 5430.
- Box, G.E.P. & Jenkins, G.M. (1970). Time Series Analysis: Forecasting and Control. Wiley.
- Holt-Winters Exponential Smoothing — statsmodels documentation
- scikit-learn Ridge Regression — Regularised polynomial regression implementation
- scikit-learn Isolation Forest — Anomaly detection algorithm
- GDELT Project — Global event database for high-frequency conflict monitoring
- ACLED — Armed Conflict Location & Event Data — Real-time conflict event data
- UNHCR Refugee Statistics — Global displacement data used for anomaly detection